
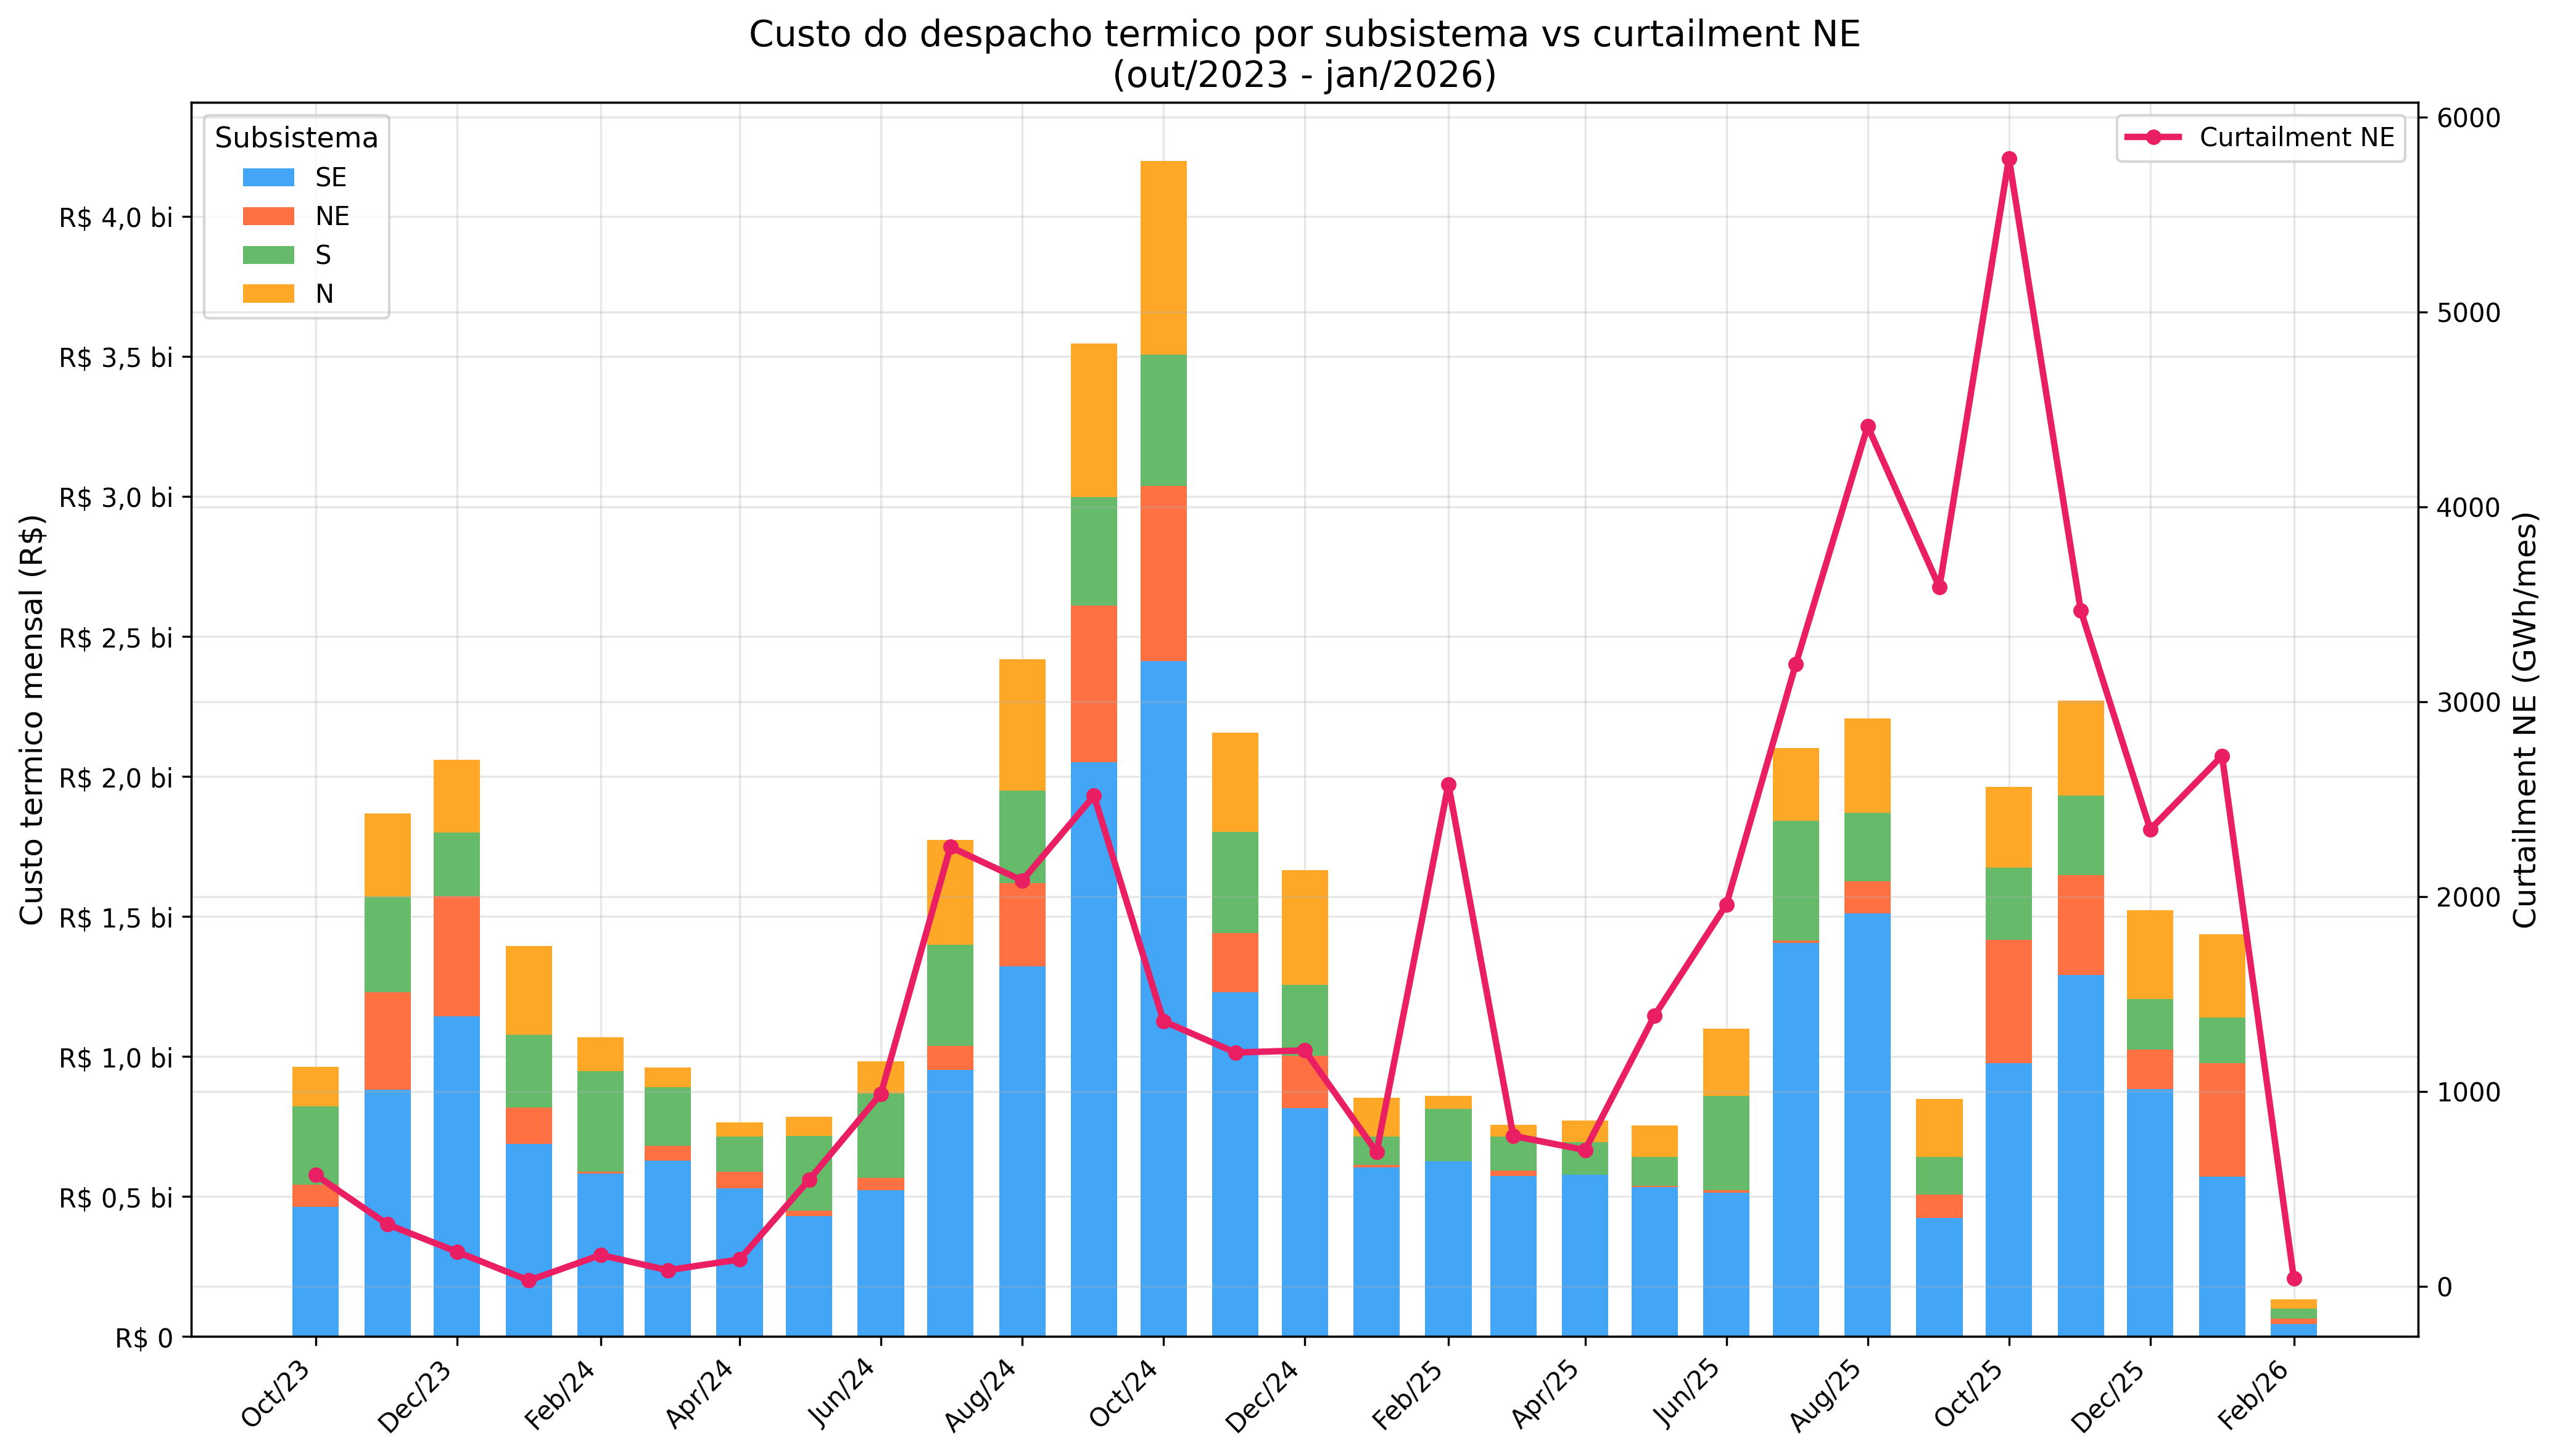
The Cost of Conservatism: 14 Months Post-Blackout
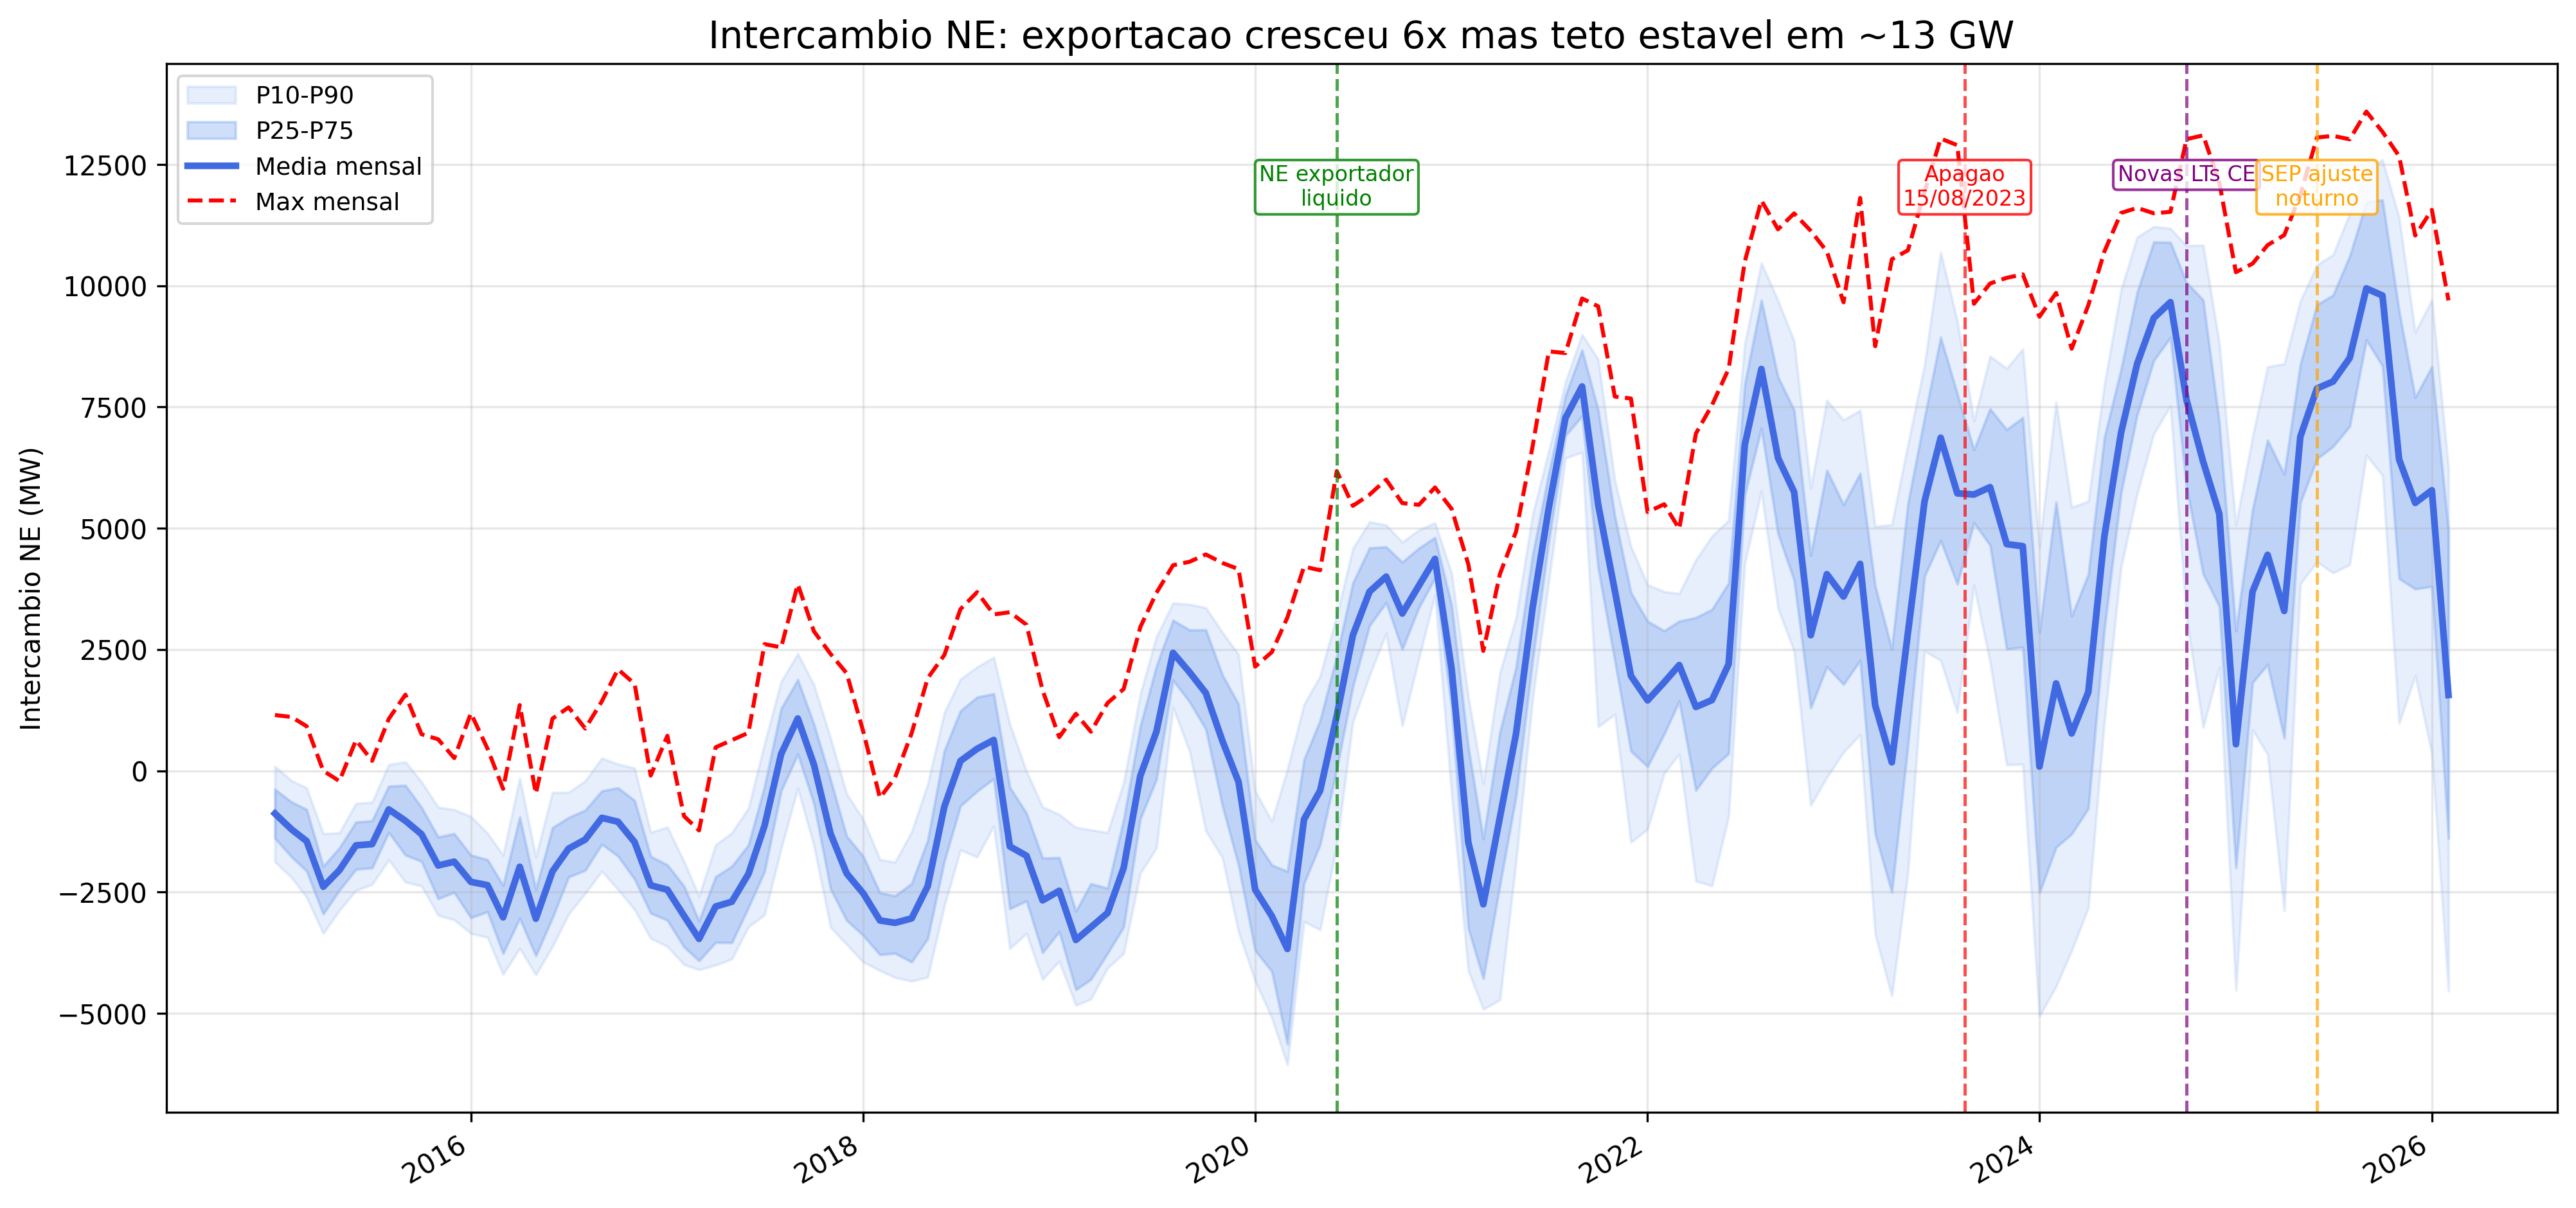
R$ 6.66 billion in curtailment since Aug/2023. NE-SE corridor intact but operated at 37-40%.
The Blind Model Cascade
NEWAVE-DECOMP-DESSEM-PDP: zero curtailment modeled across the entire chain. 87% is a surprise.
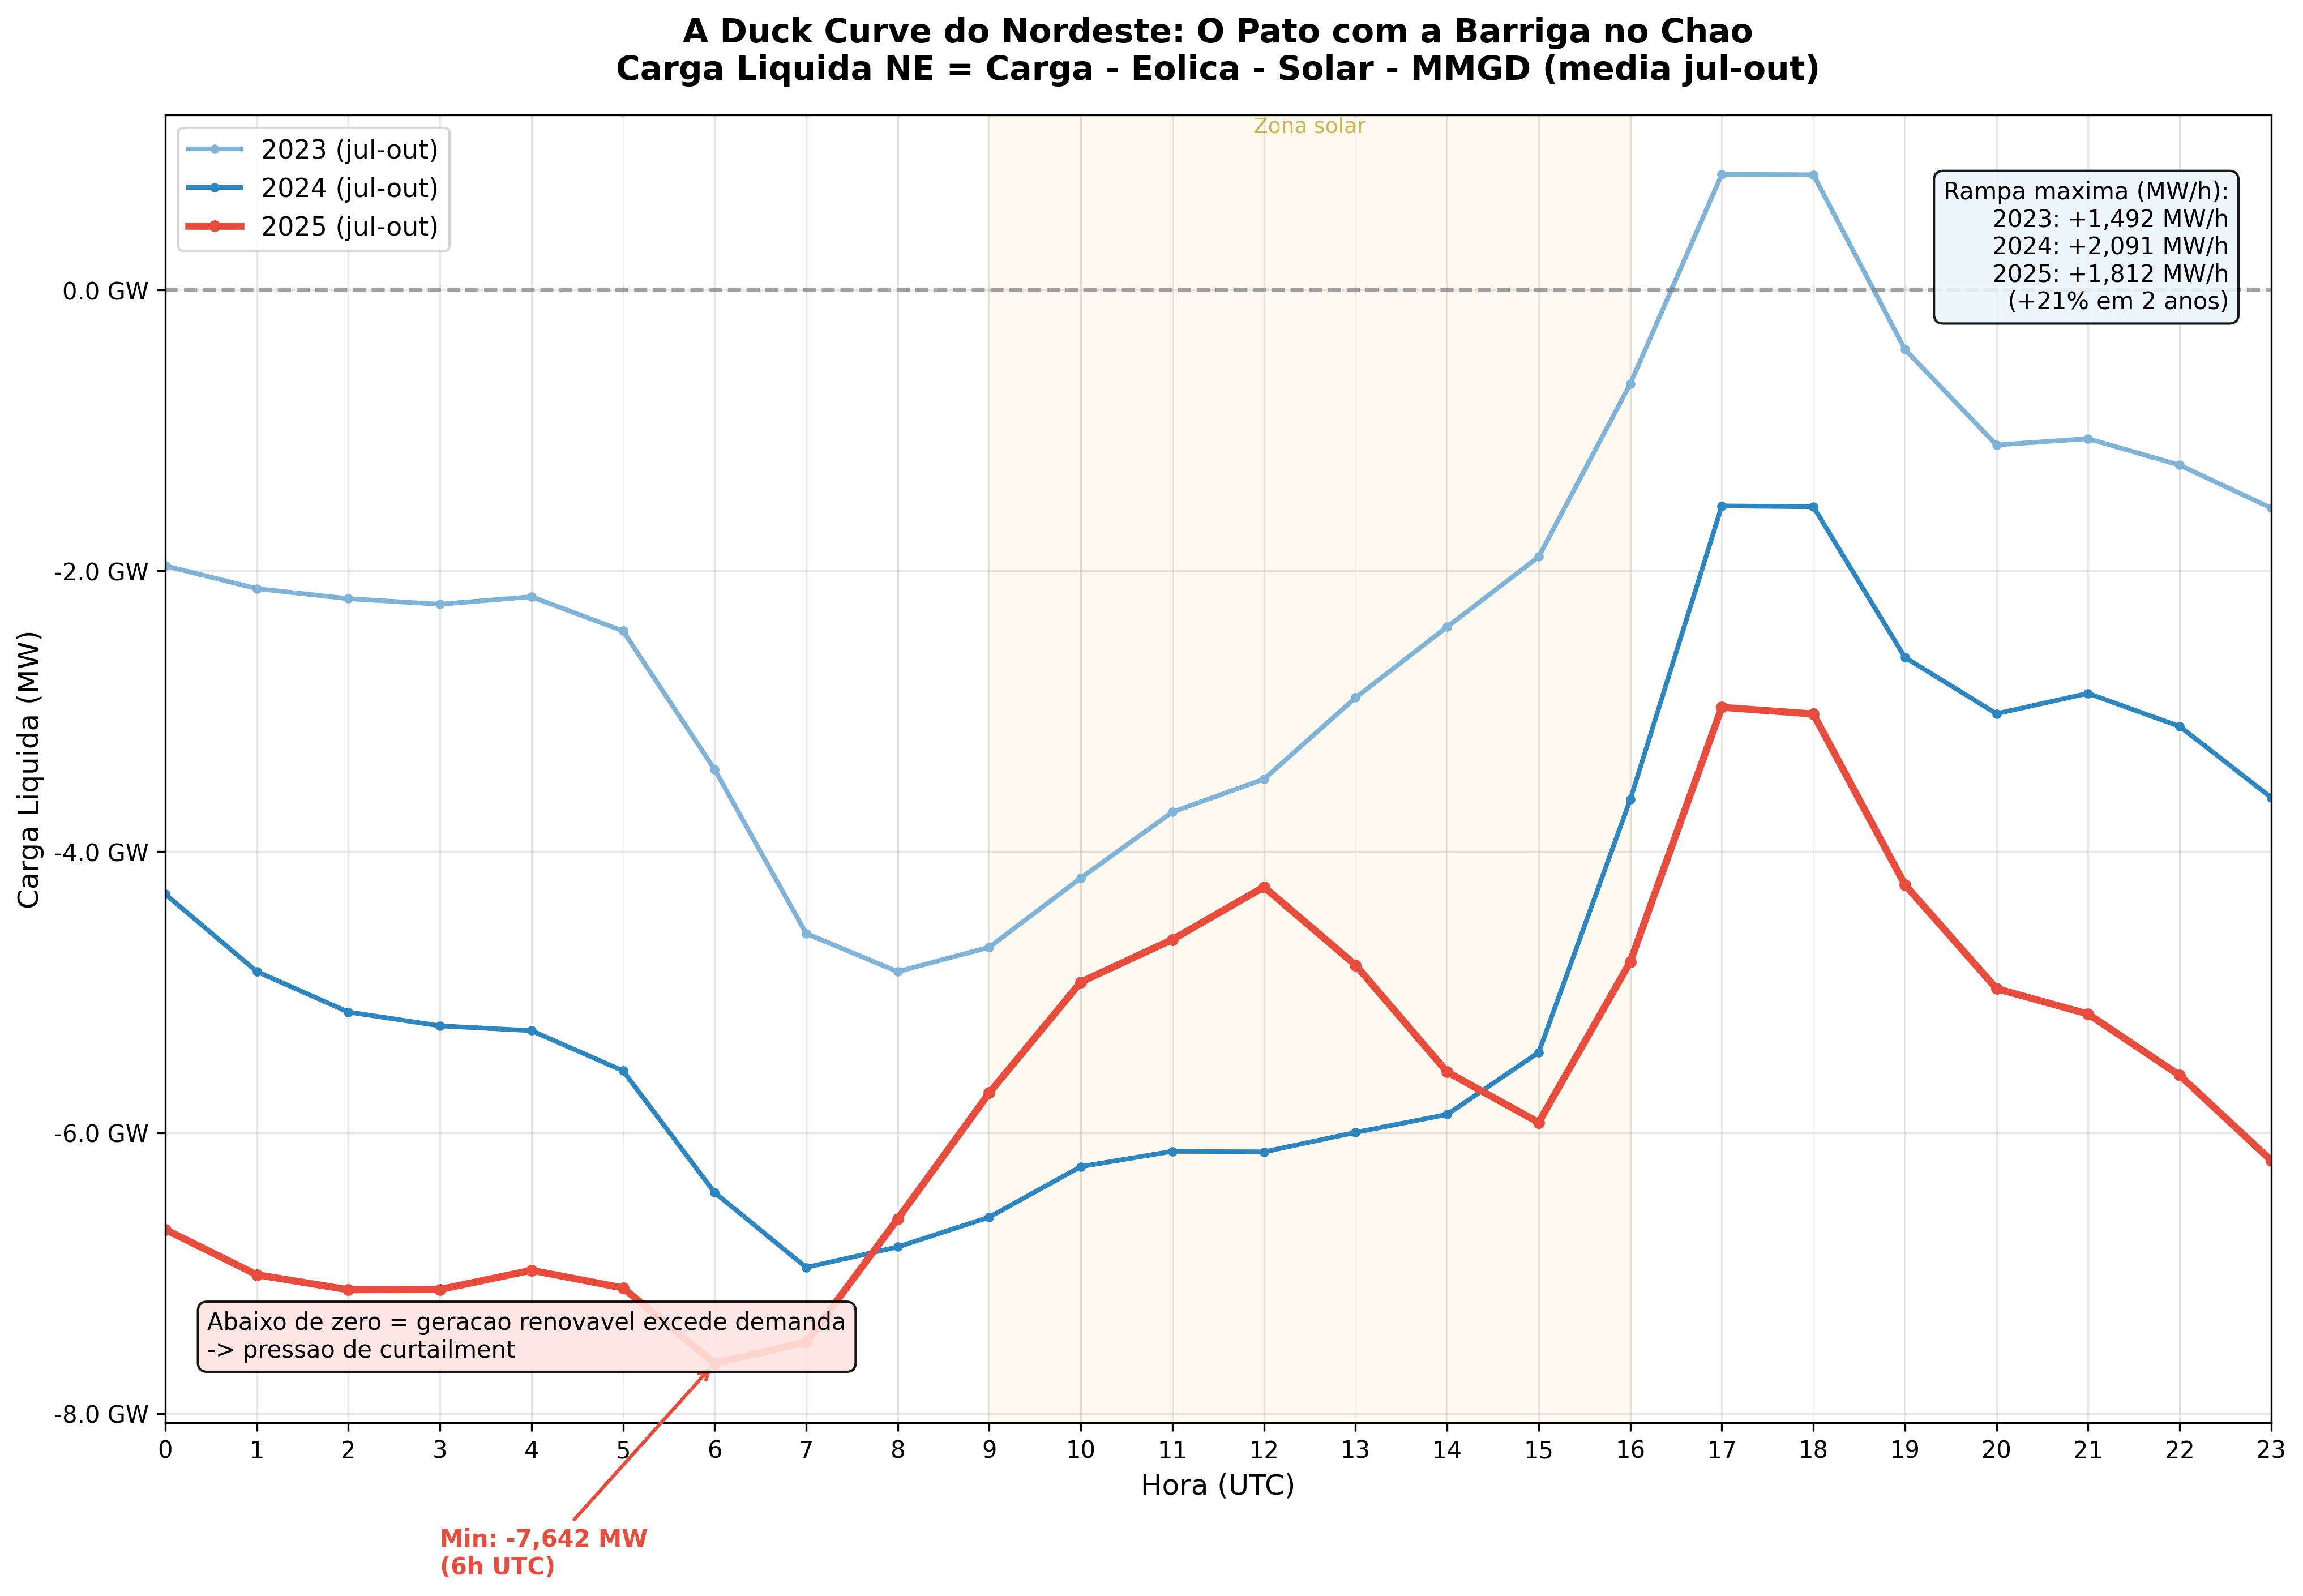
From Duck Curve to Baseload: Waste 24 Hours a Day
P10 jumped 27x. 41% of days with curtailment across all 24 hours. It's no longer a peak phenomenon.
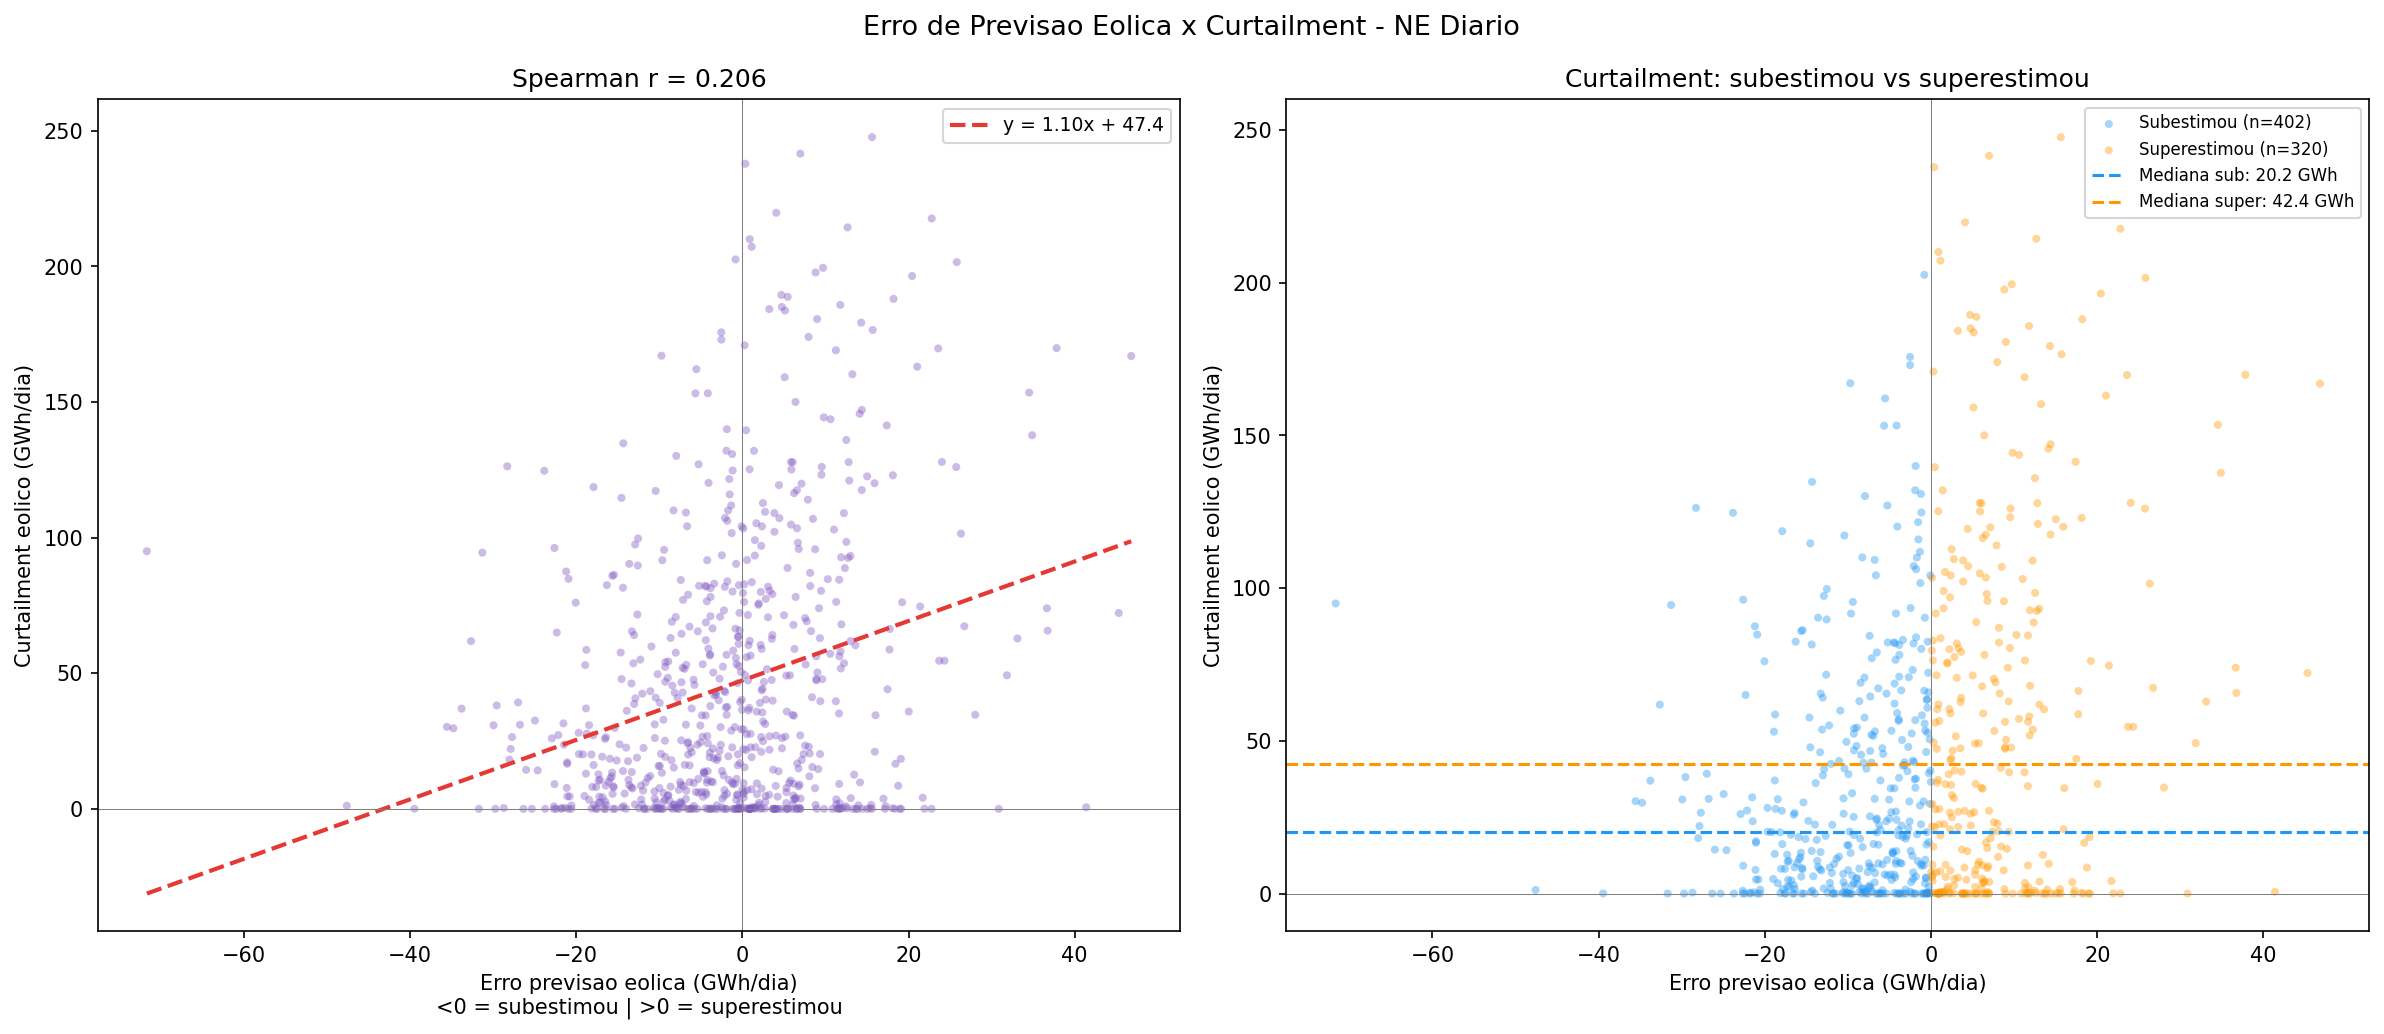
CNF or ENE? The Clock Decides Compensation
The ONS temporal heuristic that determines whether your curtailment will be compensated. R$ 3.8-4.1B at stake.
BA, MG, RN: 3 Fronts, 3 Logics
NE saturating, BA accelerating, MG emerging. 11 states, 3 incompatible dynamics.
MG Solar: 3 Invisible Bottlenecks, +469%
5.18 TWh solar curtailment in MG. Three independent bottlenecks, no planned TX investment.
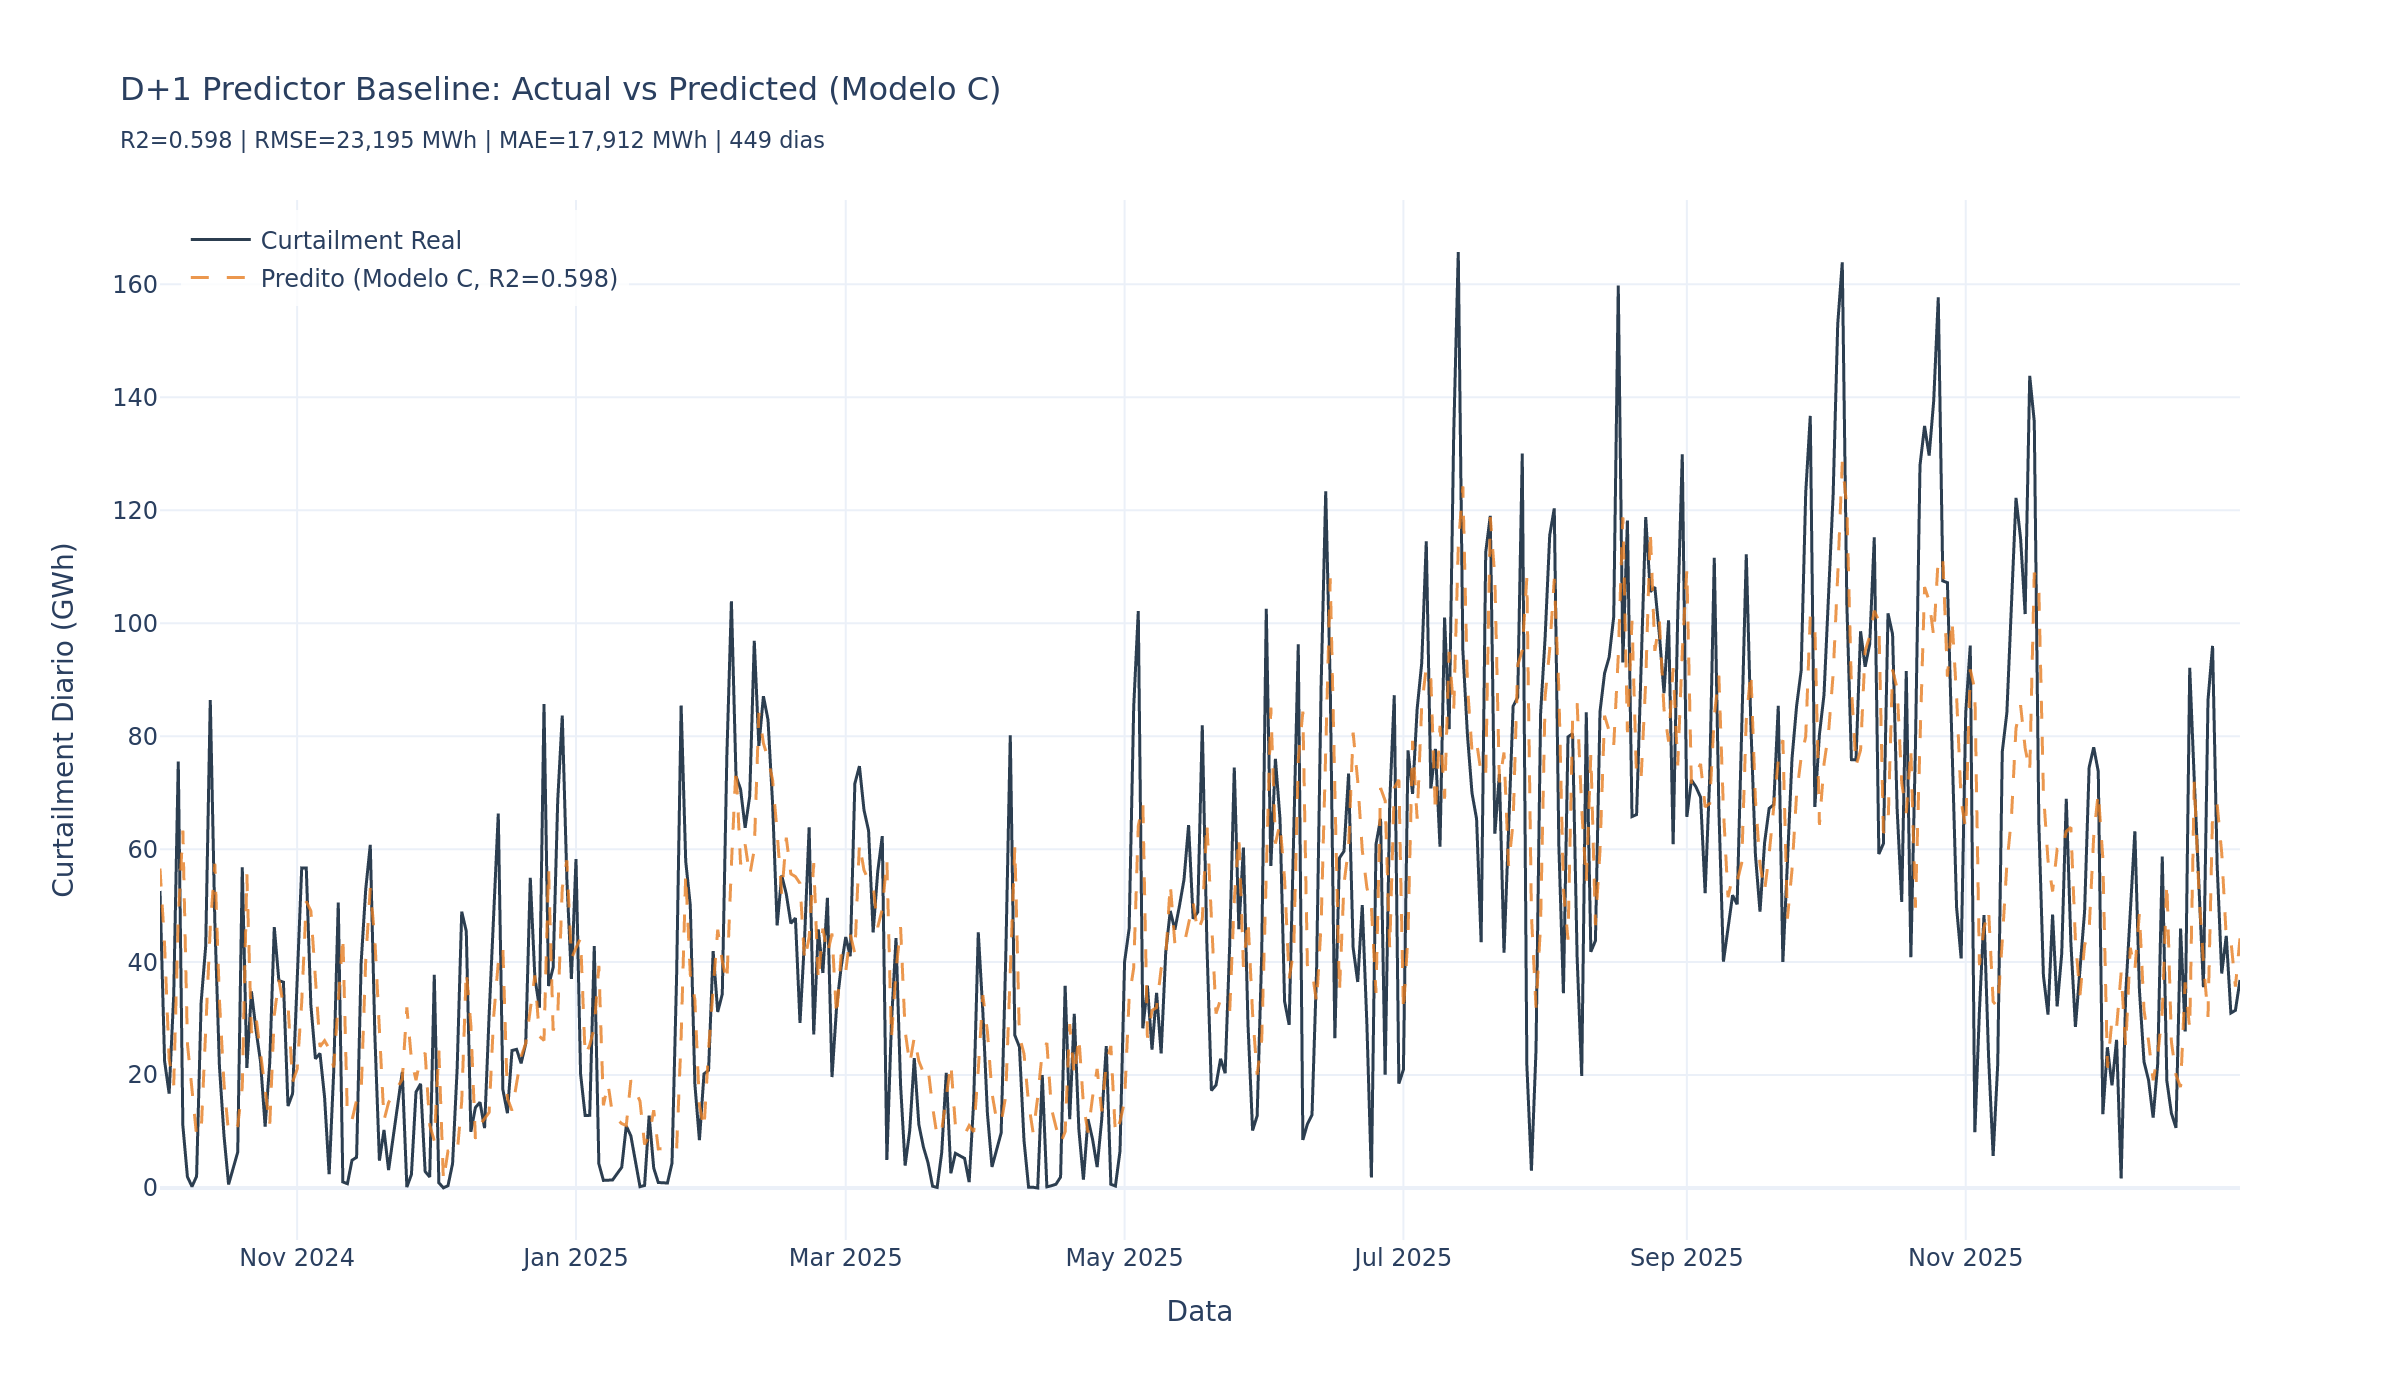
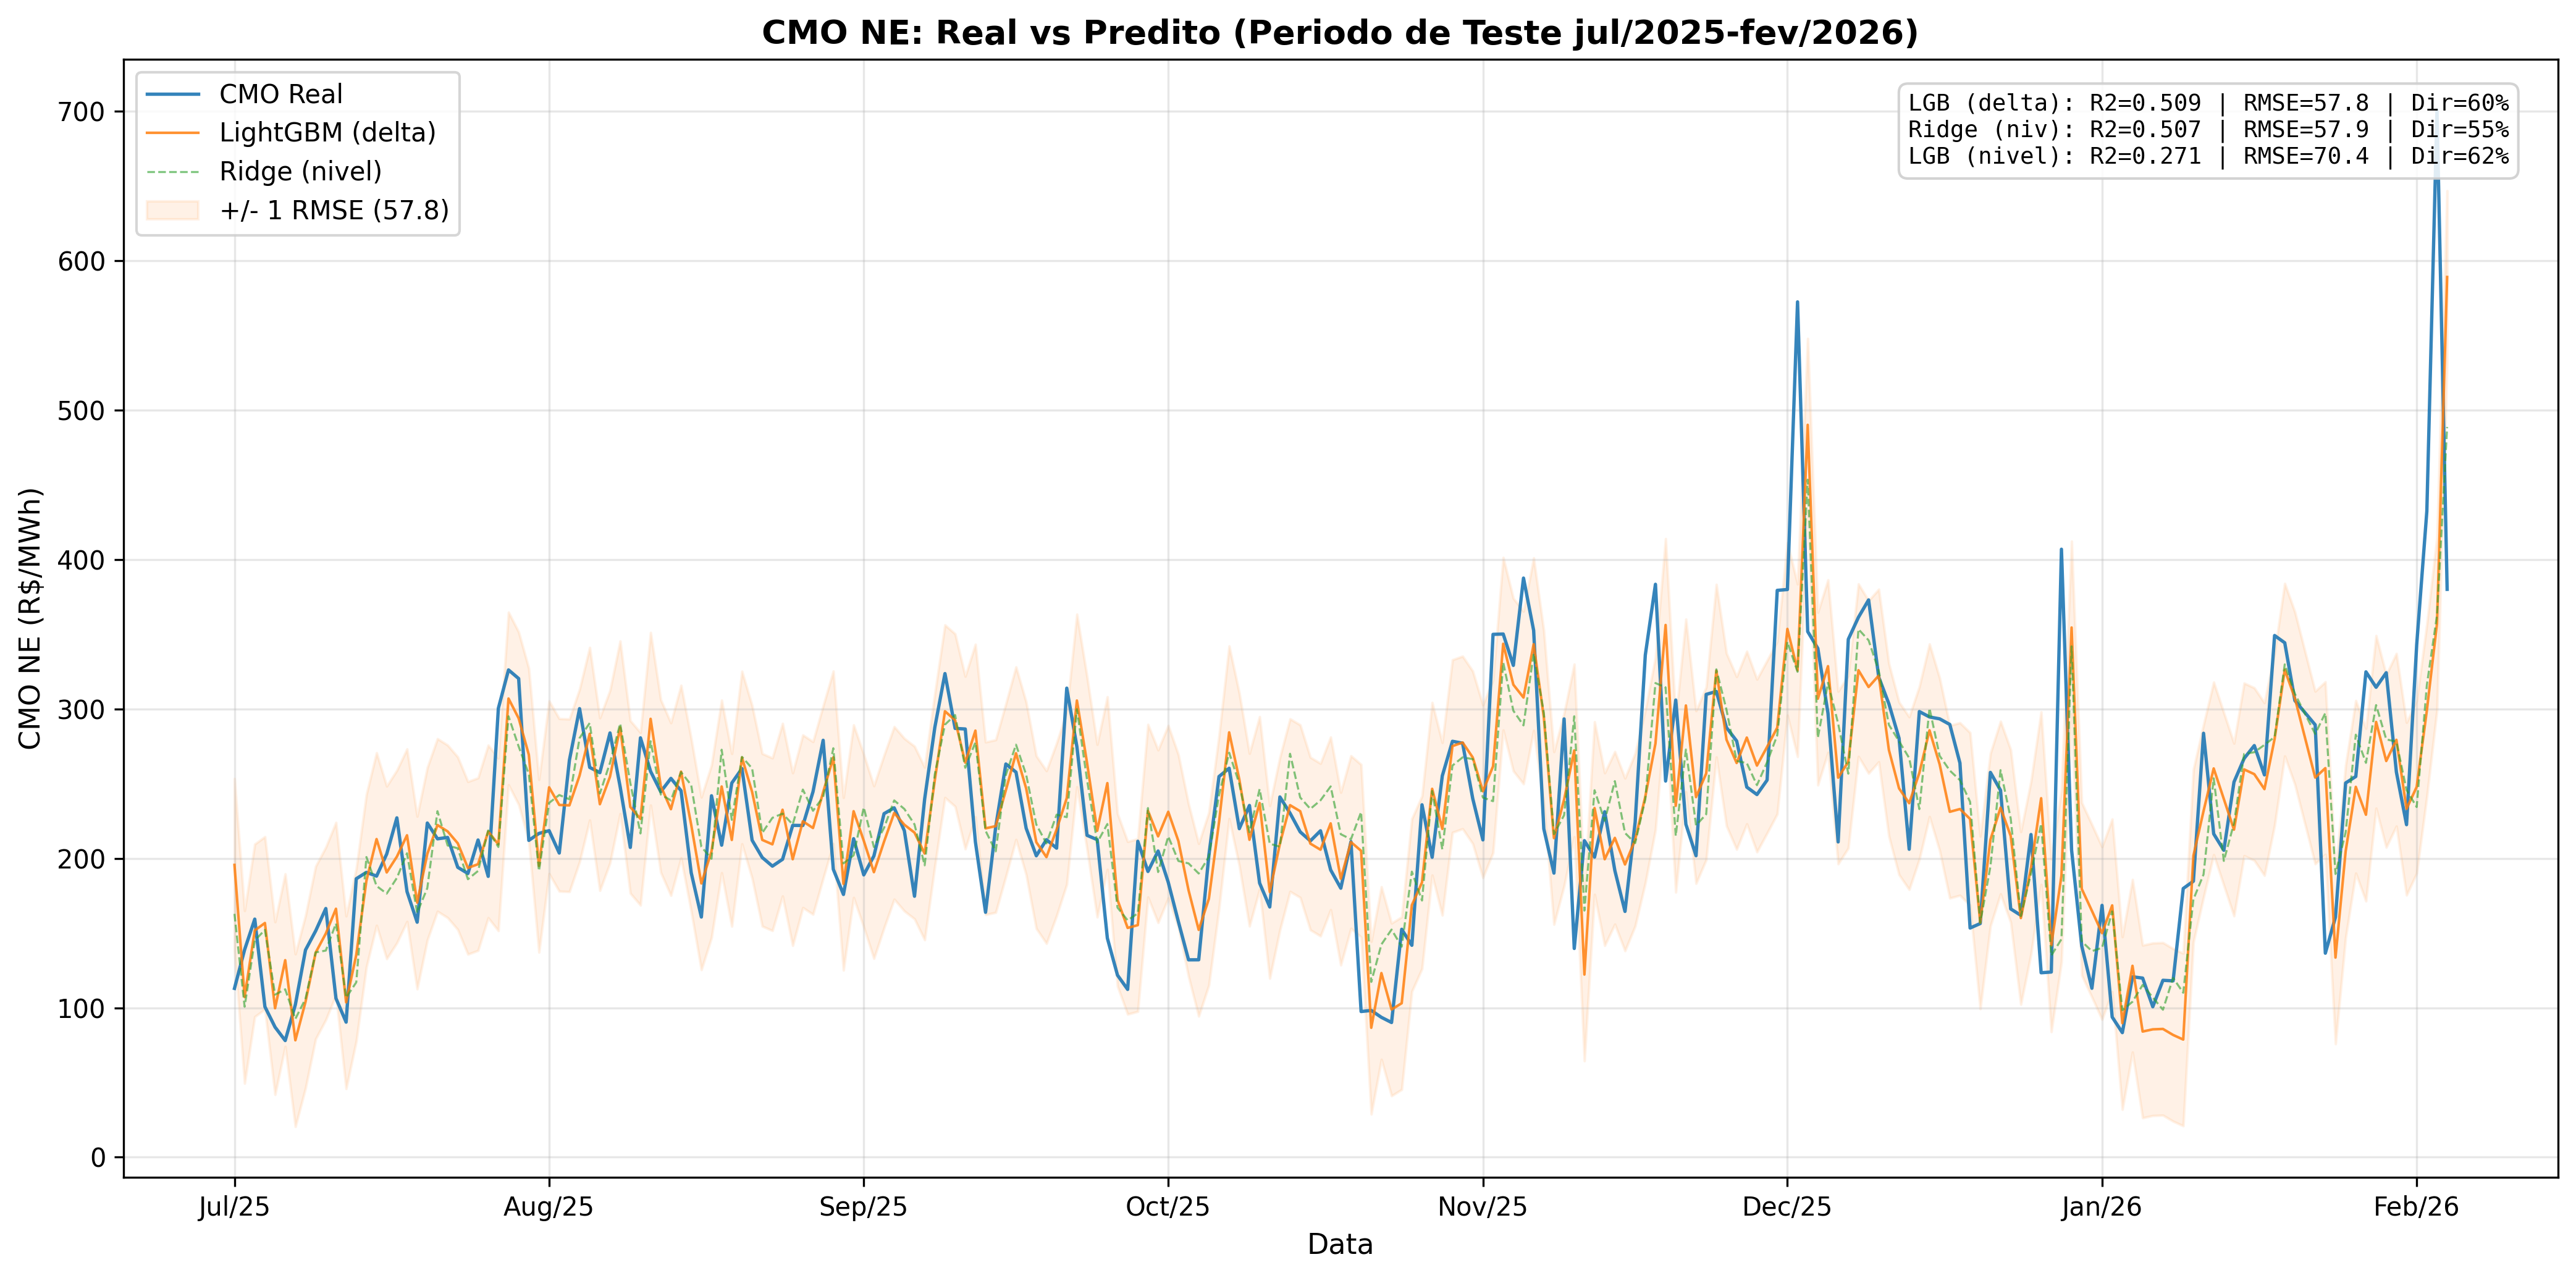
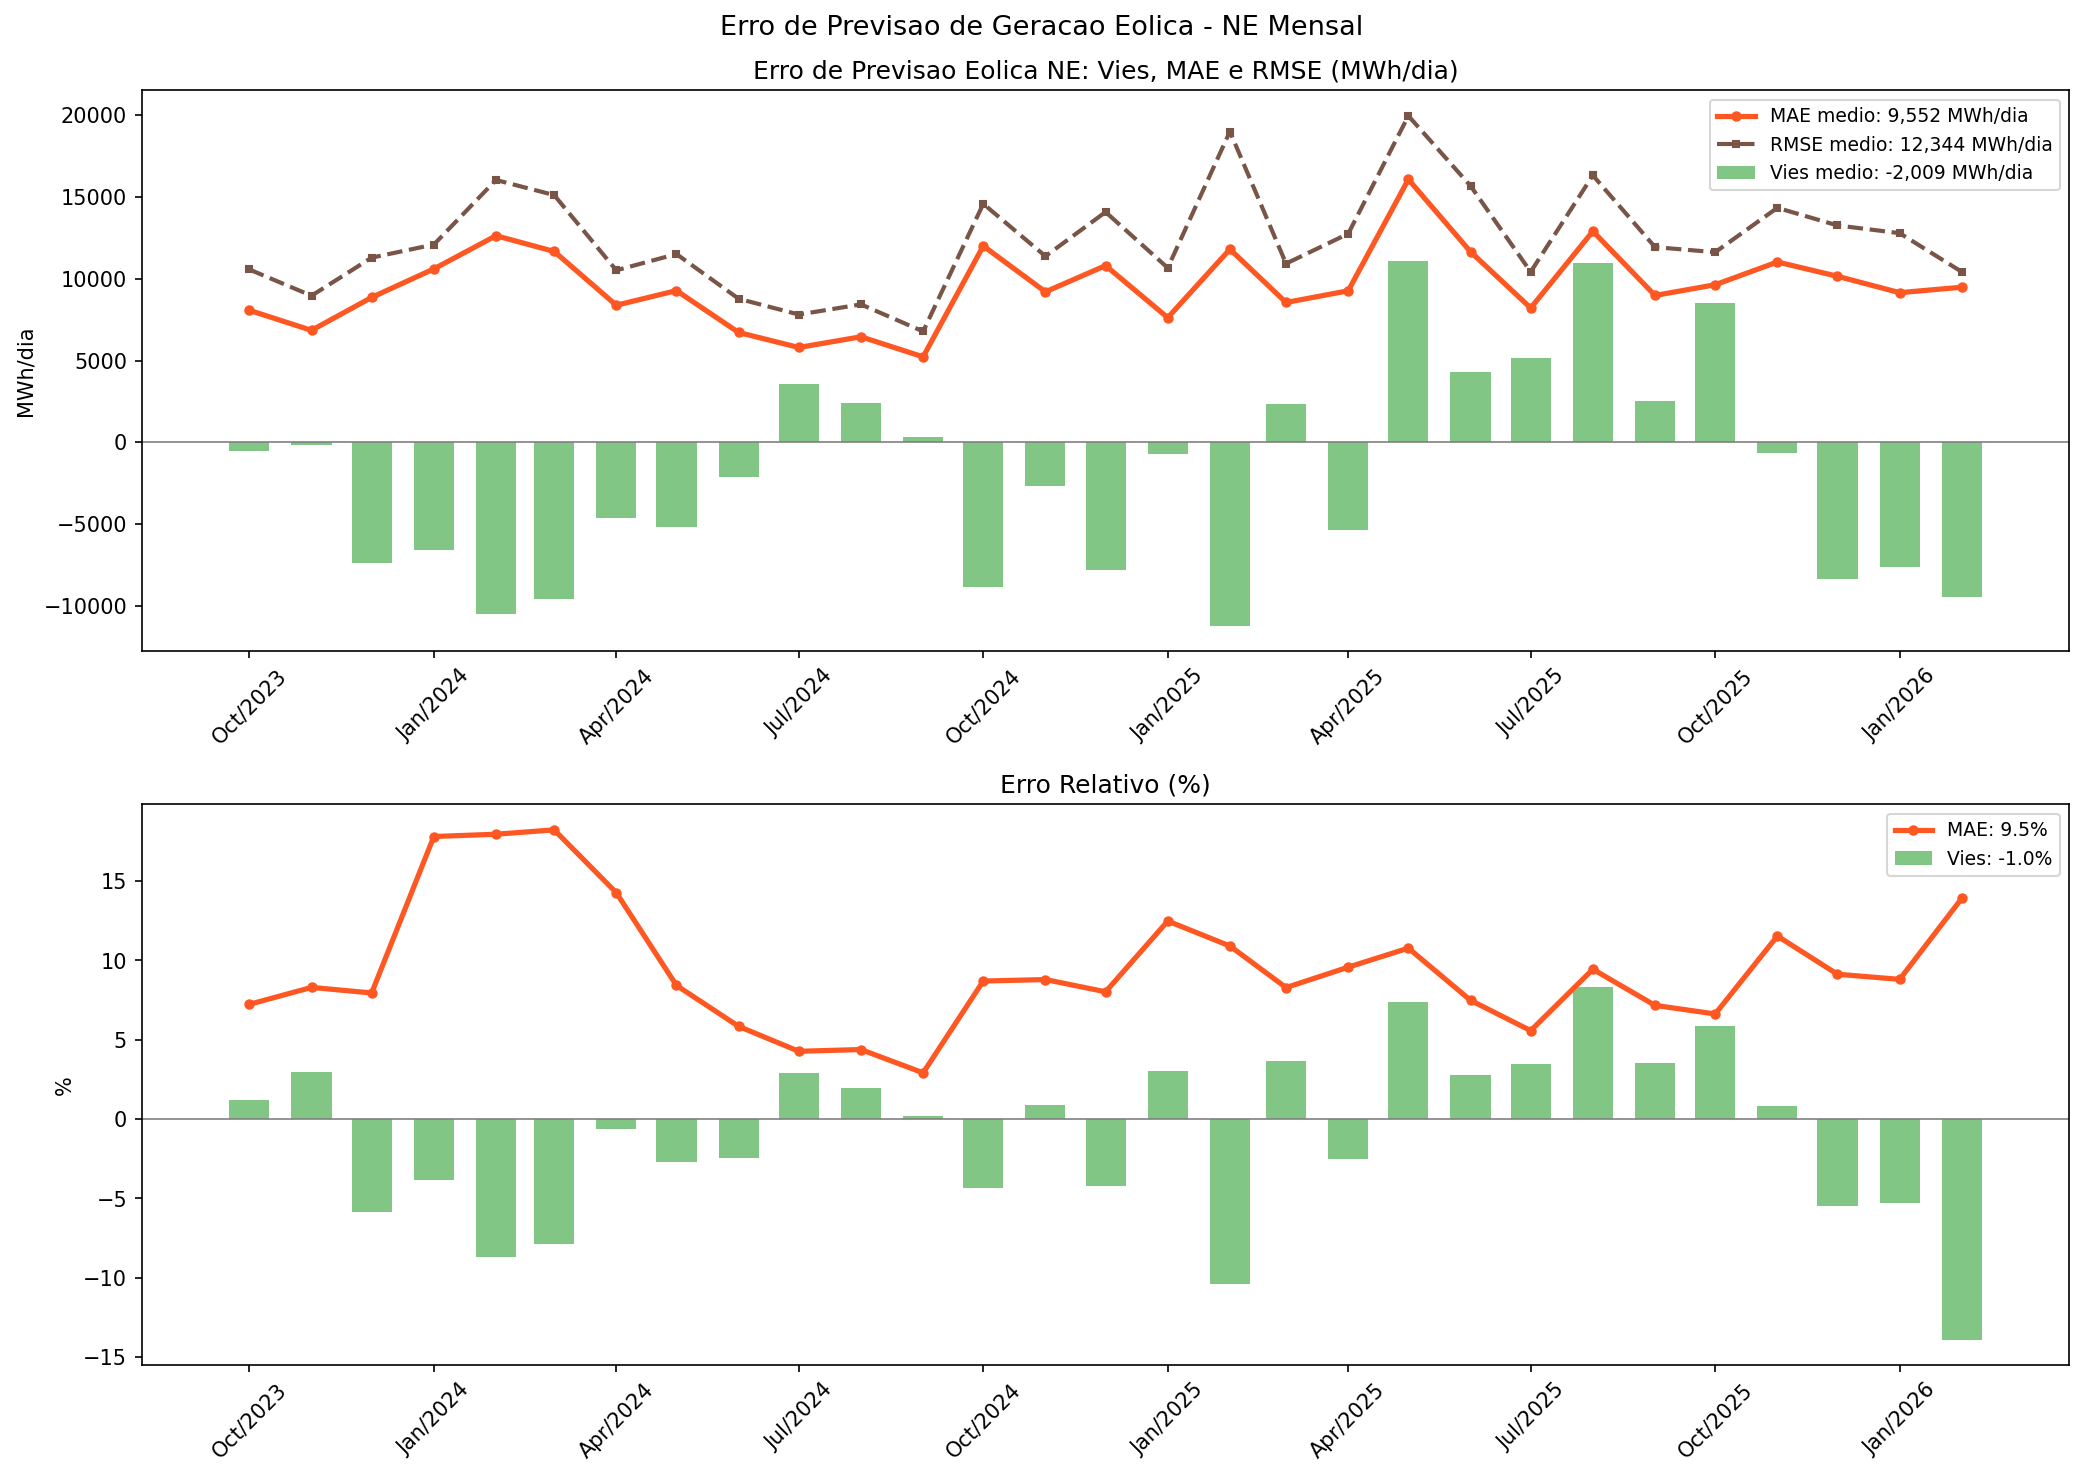
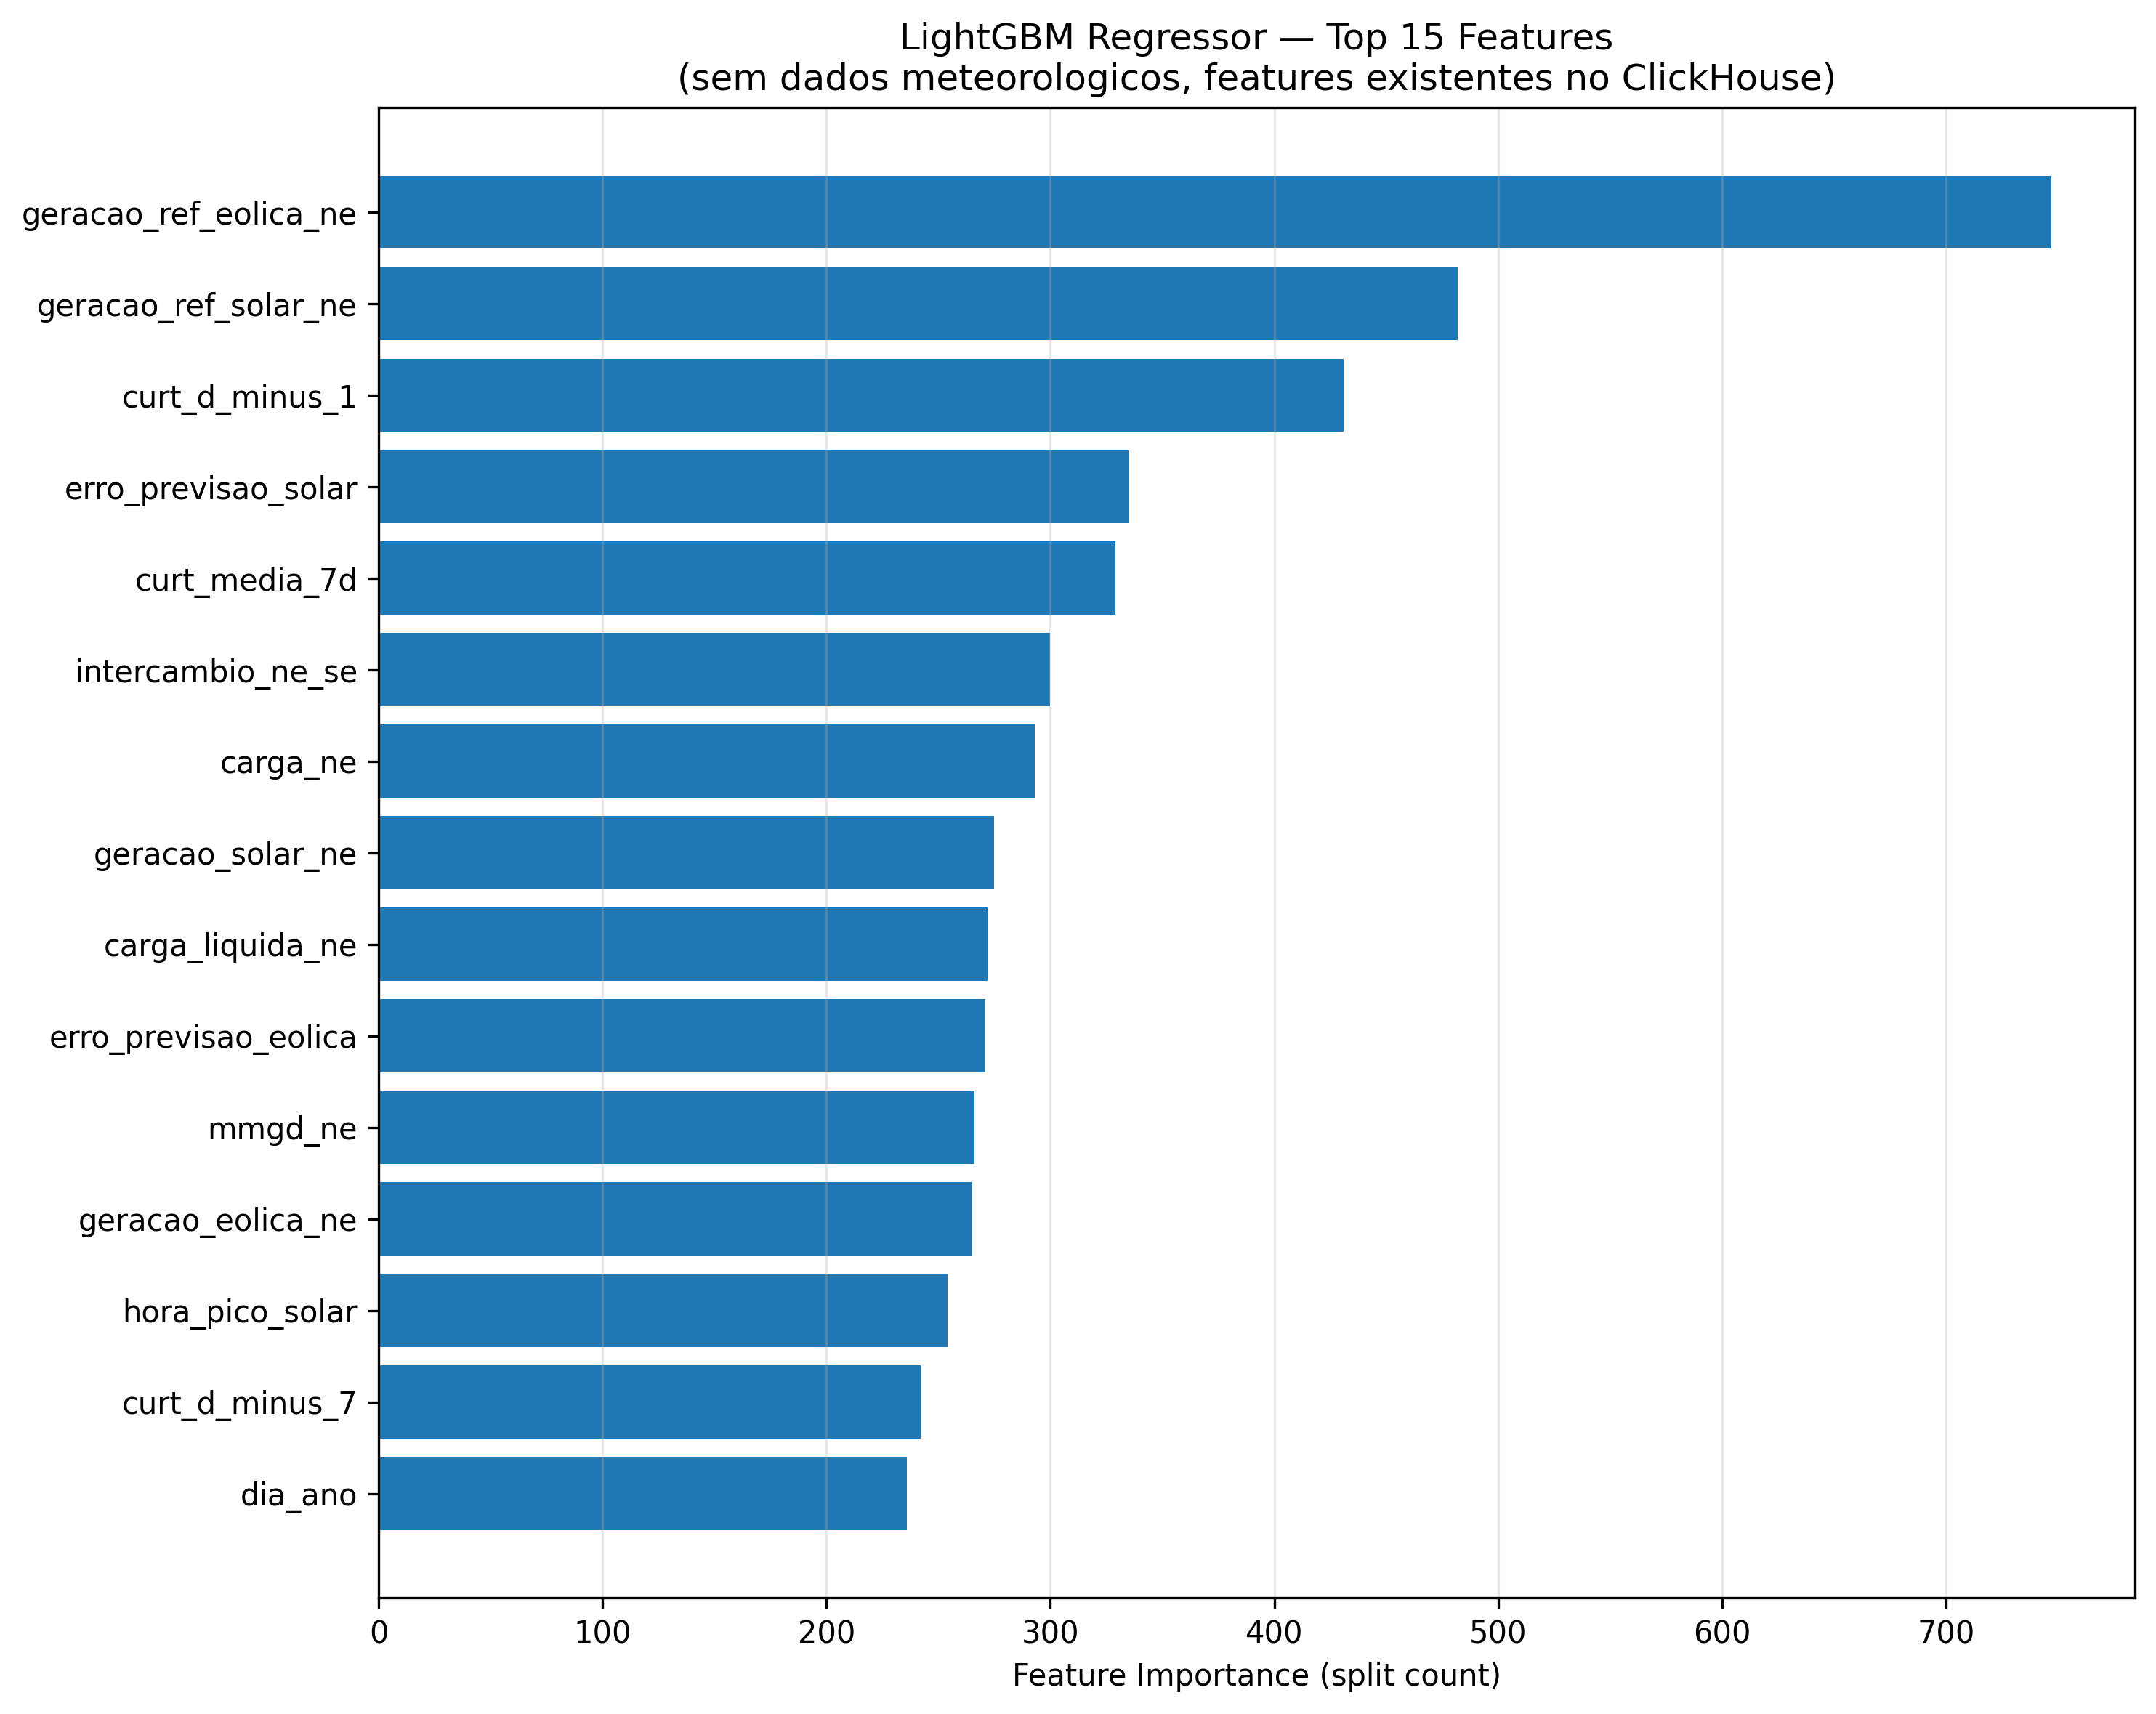
BrazilGrid vs ONS: D+1 and Load Forecasting
BG beats ONS in 3/4 subsystems. D+1 curtailment R2=0.70. CMO regime switching.
Data Centers: 7 GW as an Antidote to Curtailment
26.2 GW in connection requests. The NE has energy to spare -- literally.
Campina Grande III and Flow Reversals
#1 constraint by Feb/2026 + 1,399 periods with reverse NE-SE flow
The Renewable Exodus: R$5B Destroyed, 662 Plants Revoked
27.8 GW that will never be built -- 2x Itaipu abandoned
Radialization and Janauba: When One Piece of Equipment Costs R$115M
A single piece of equipment offline since Oct/2025 causes 471 GWh in the NE. 4,162 GWh from one substation.
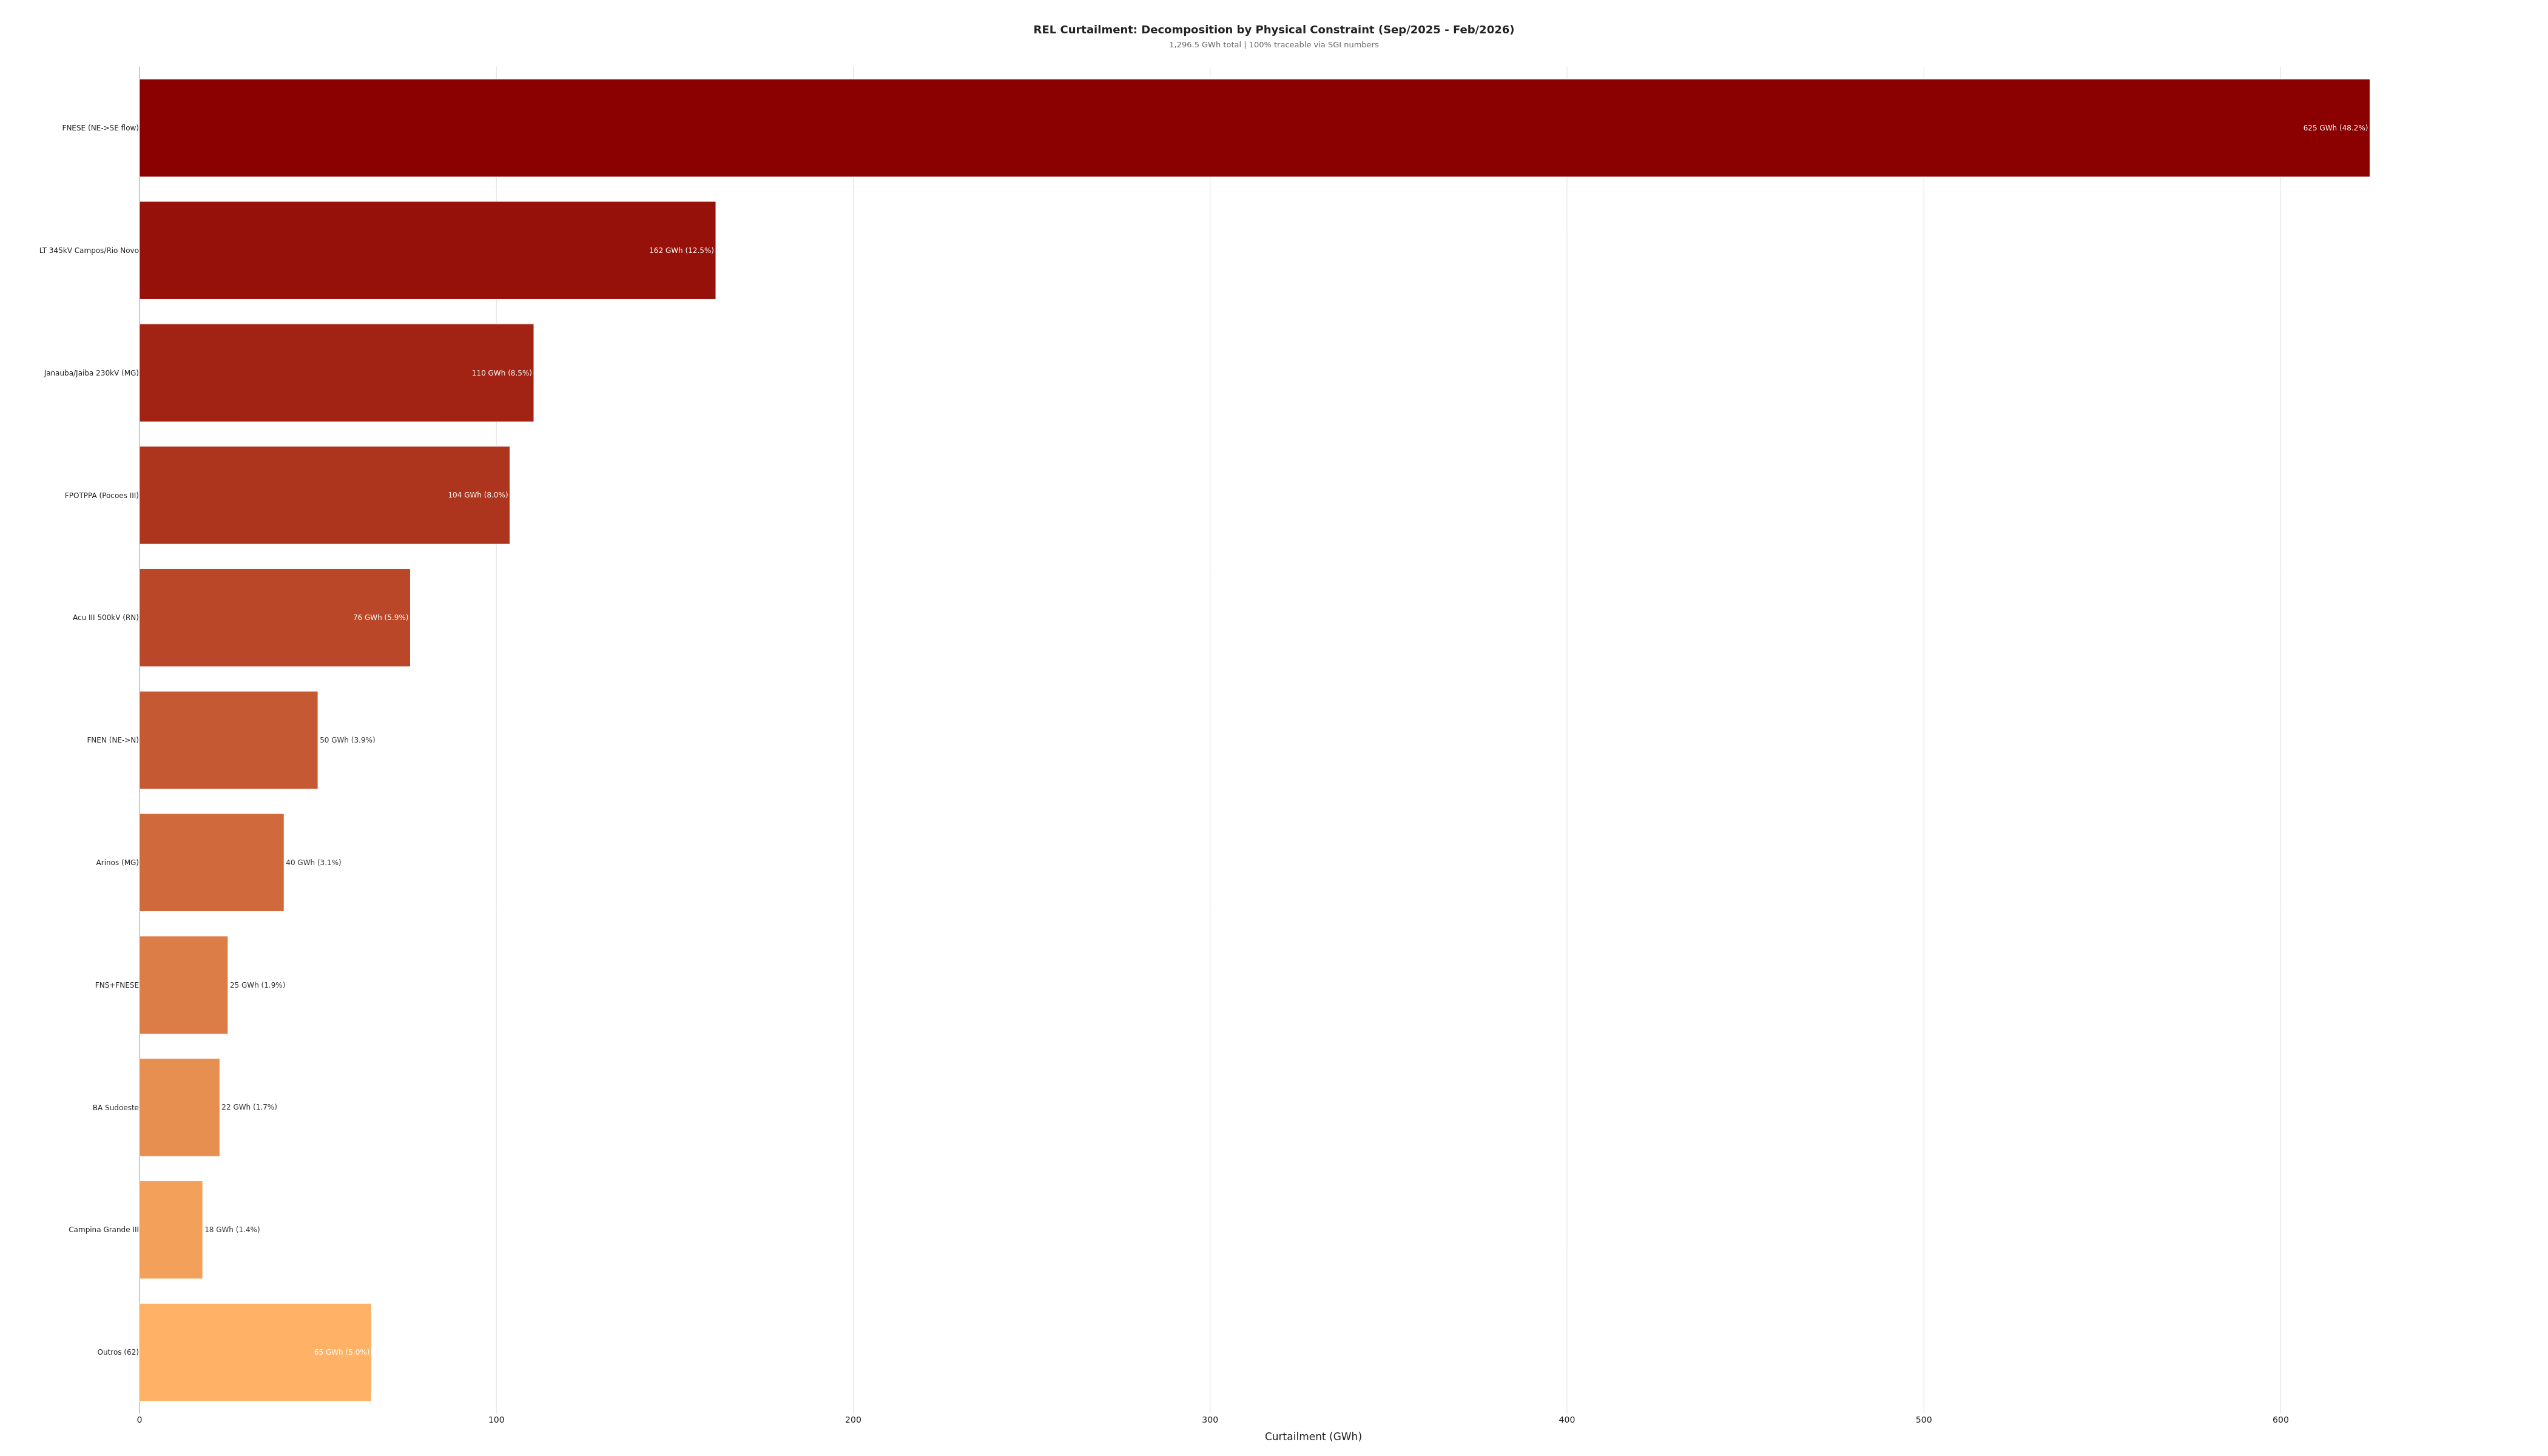
6 Constraints That Explain 95% of Curtailment
First complete decomposition by constraint using ONS data with 100% coverage
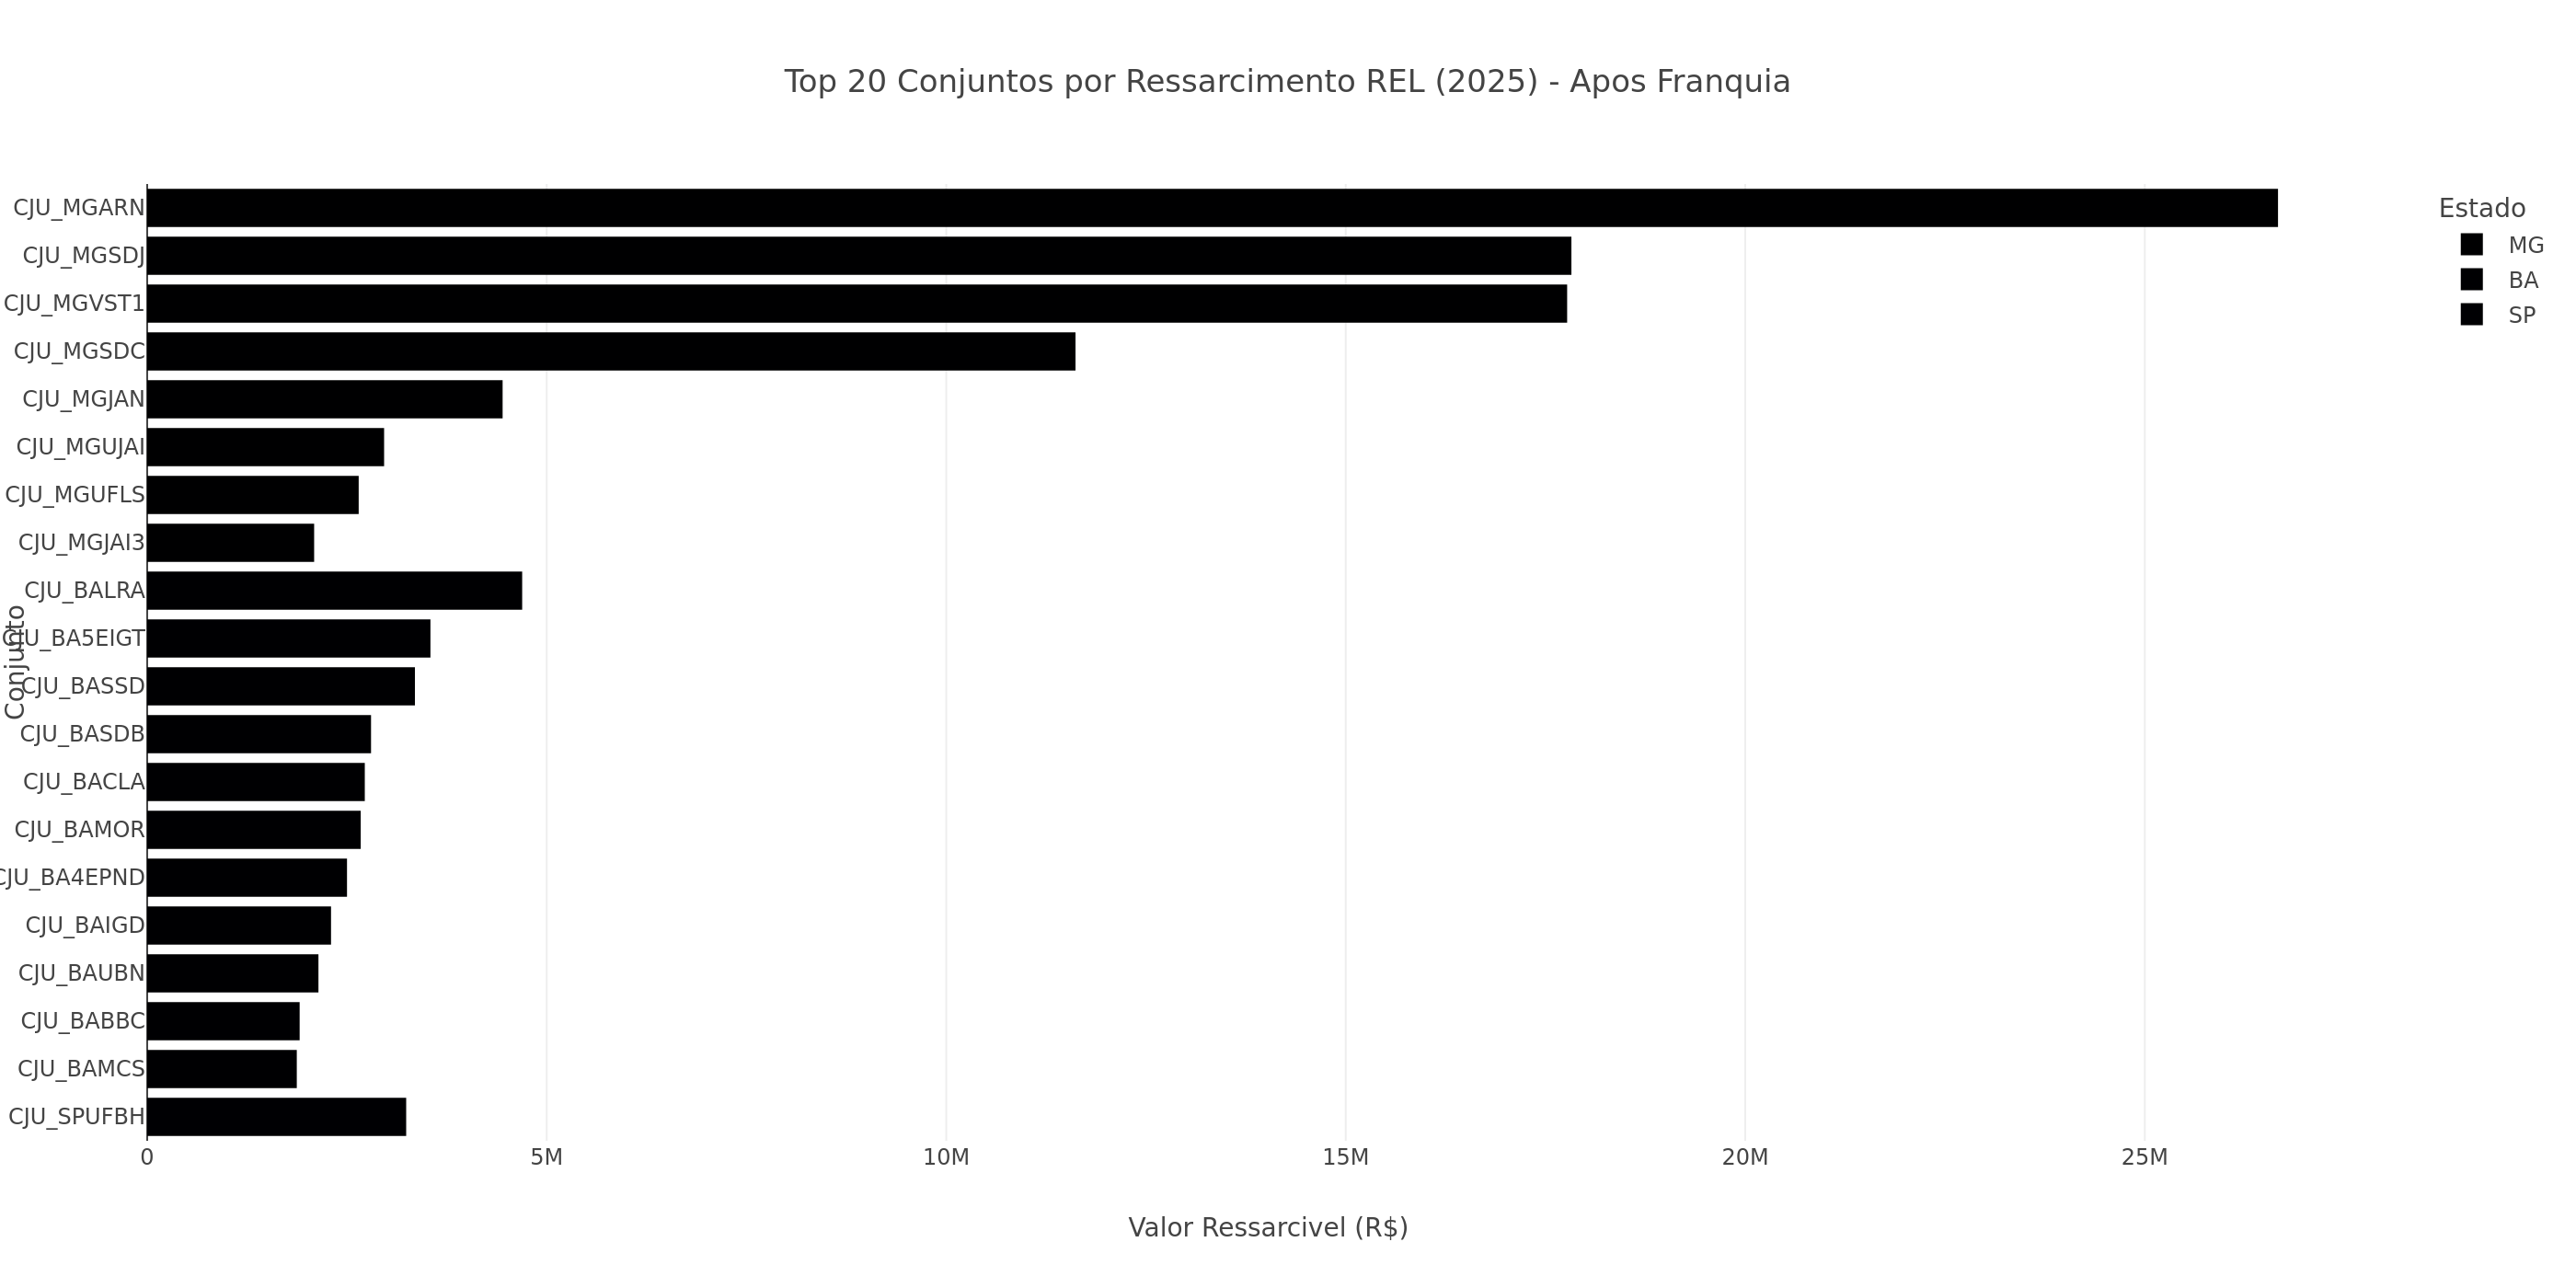
Retroactive Compensation: R$1.77B
Law 15,269/2025 -- how much each generator is owed, calculated record by record
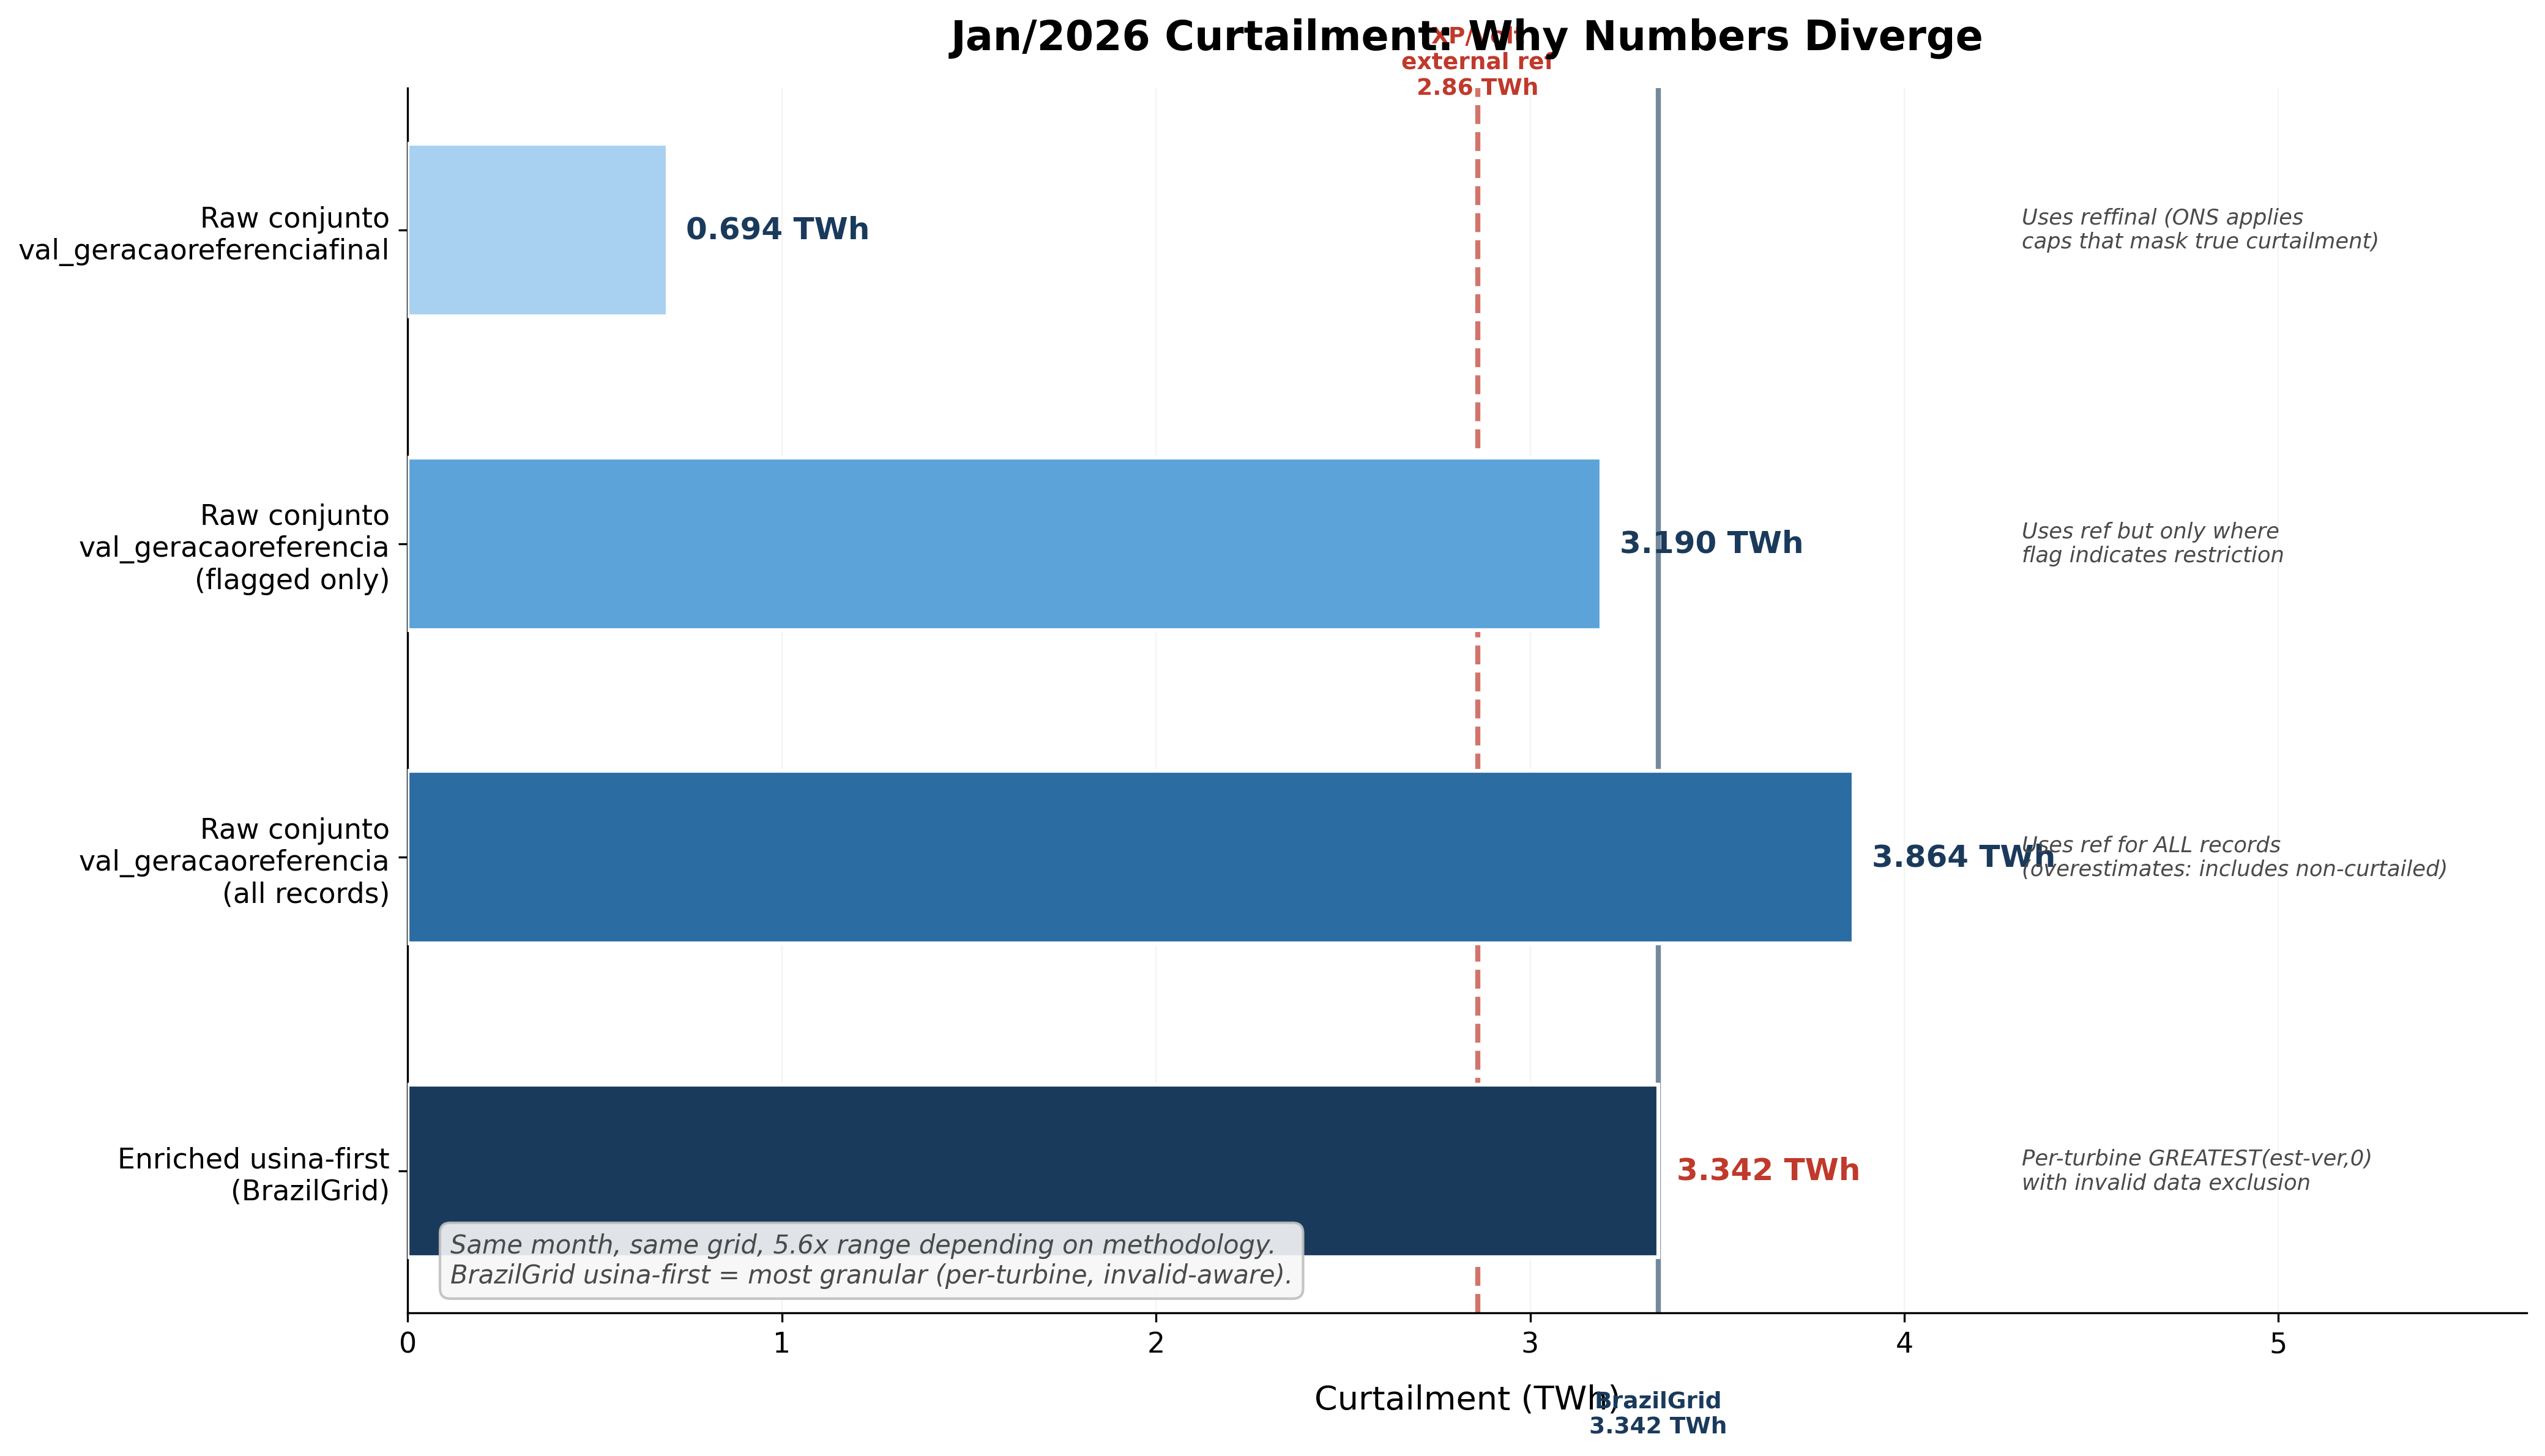
January 2026: Every Record Broken + The False Lack of Demand
3.3 TWh curtailed with load +19%. It's not lack of consumption -- it's a grid bottleneck.
Blind DECOMP and the Paradoxical Thermal in the NE
DECOMP assumes 100% dispatchable. Reality: 37-42% curtailed. R$ 844M in coincident thermal.
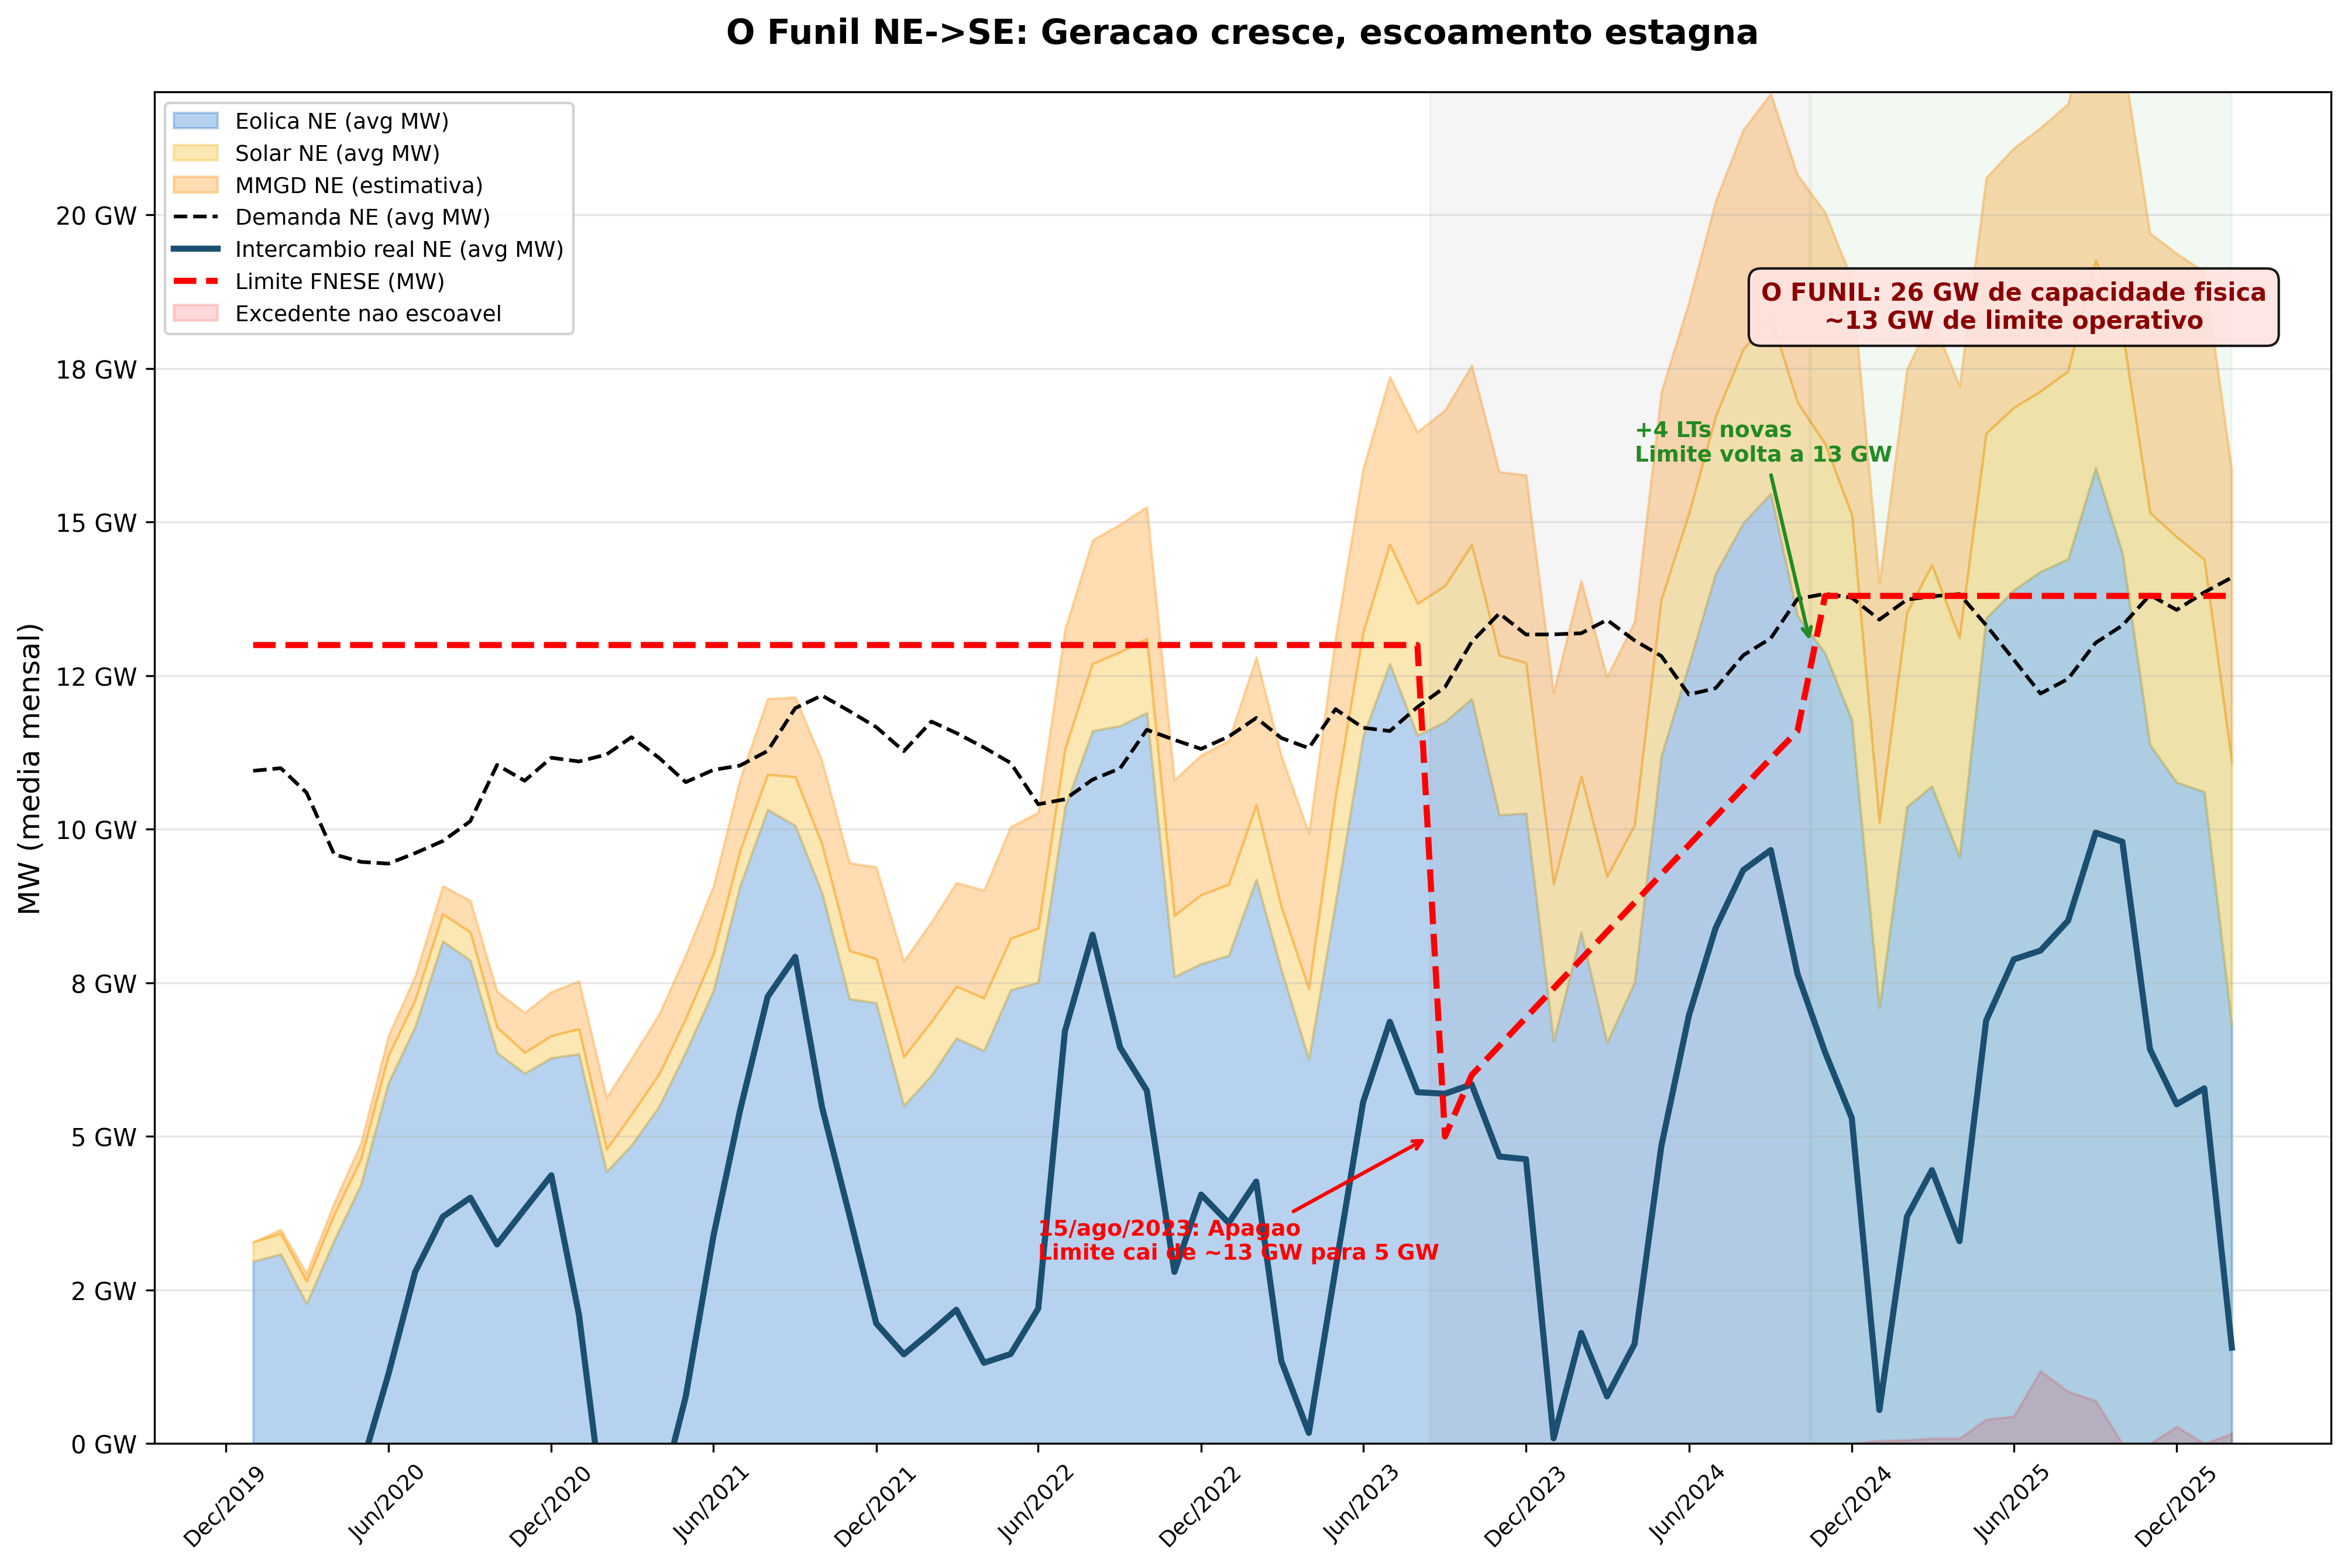
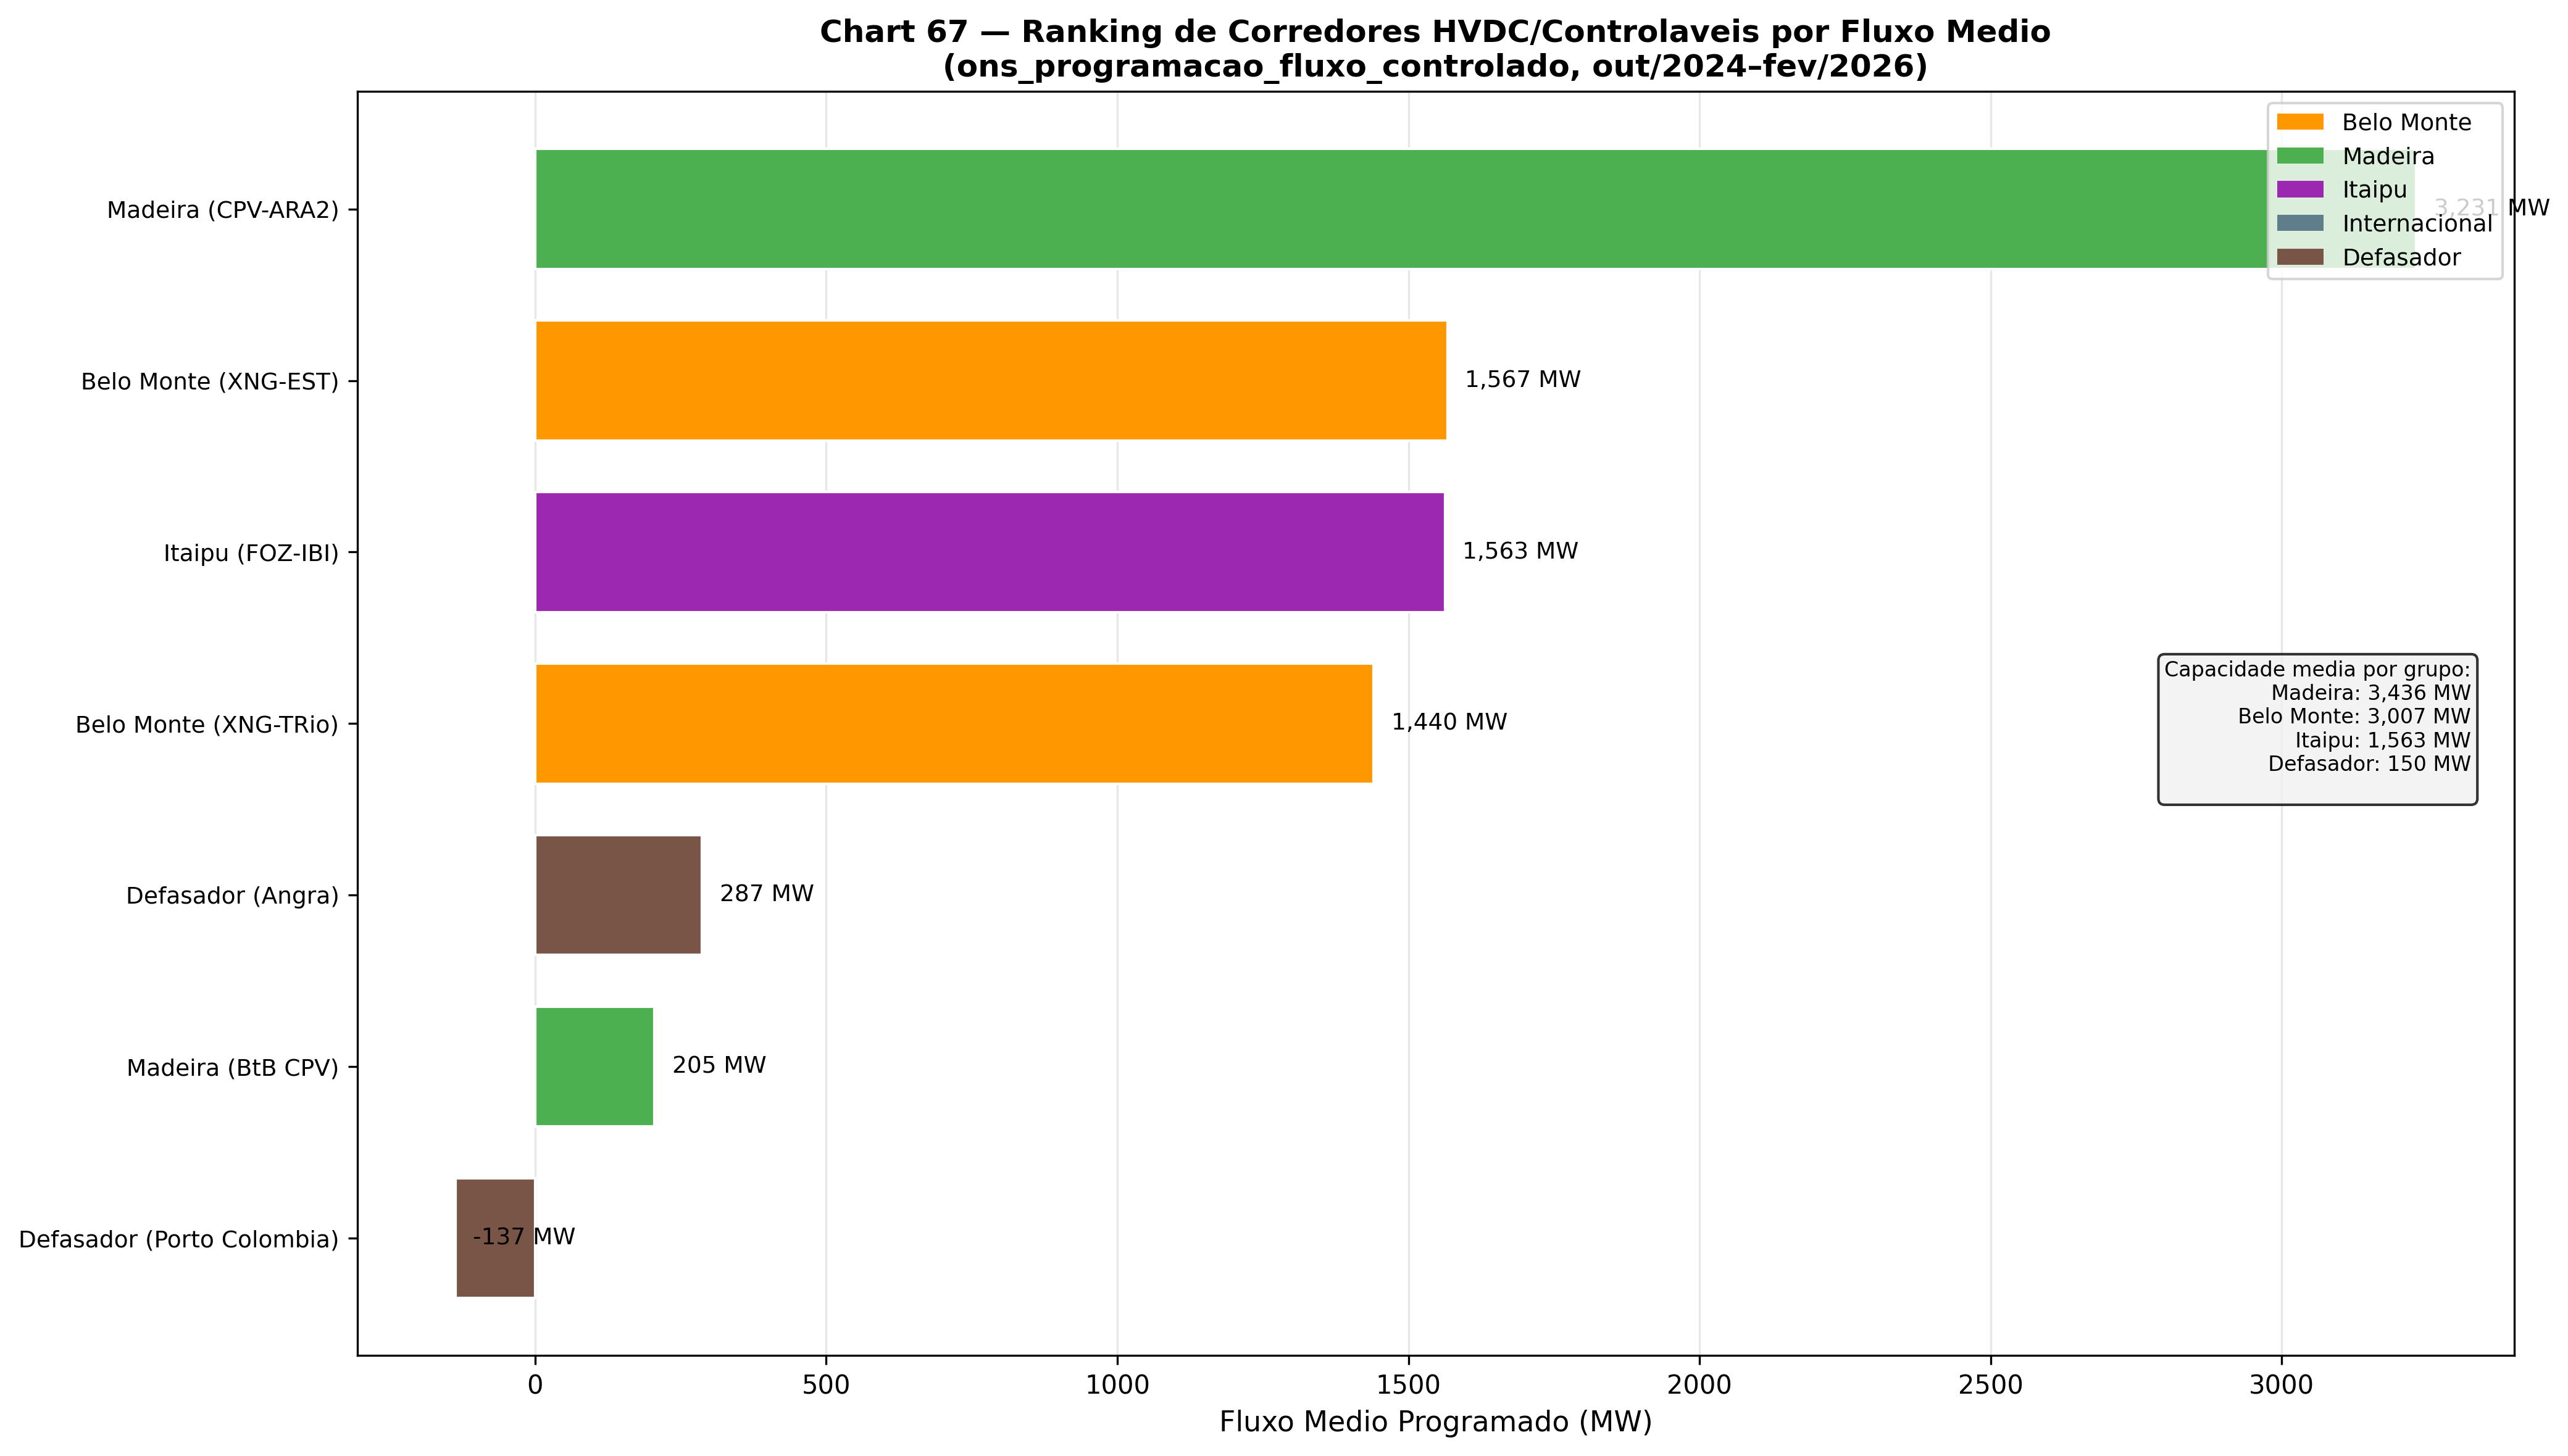
The NE-SE Funnel and the Cost of Congestion
11 lines at 500 kV, 26 GW nominal, R$ 1.77 billion/year in invisible congestion
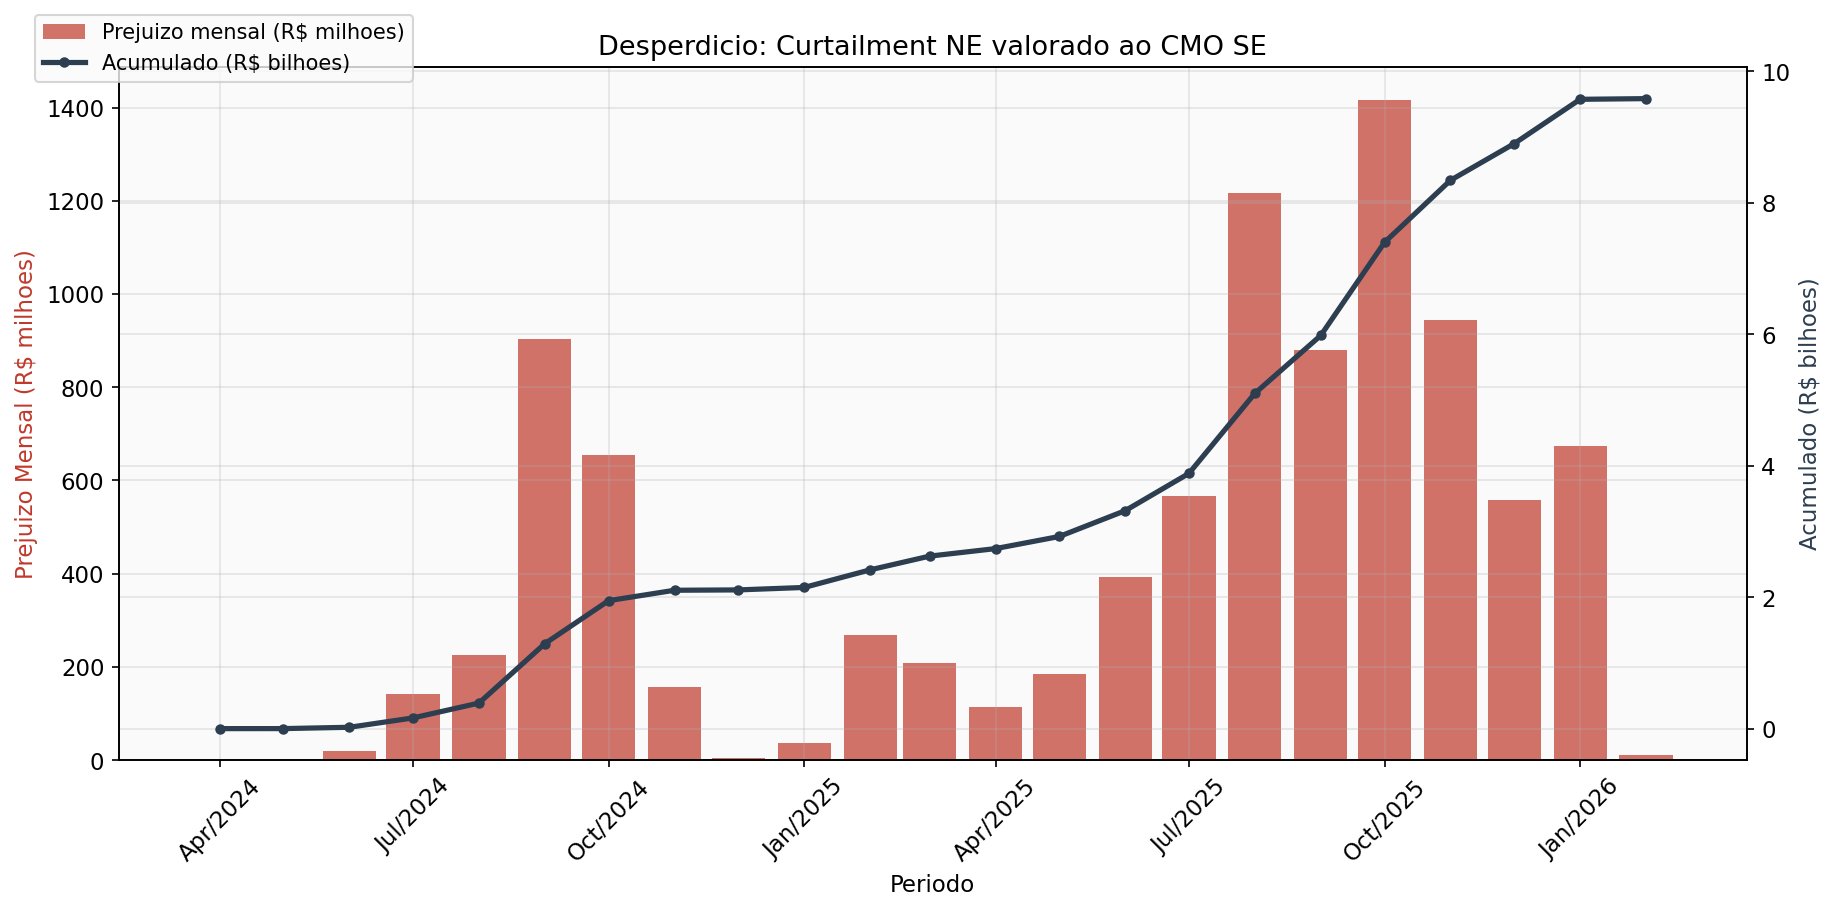
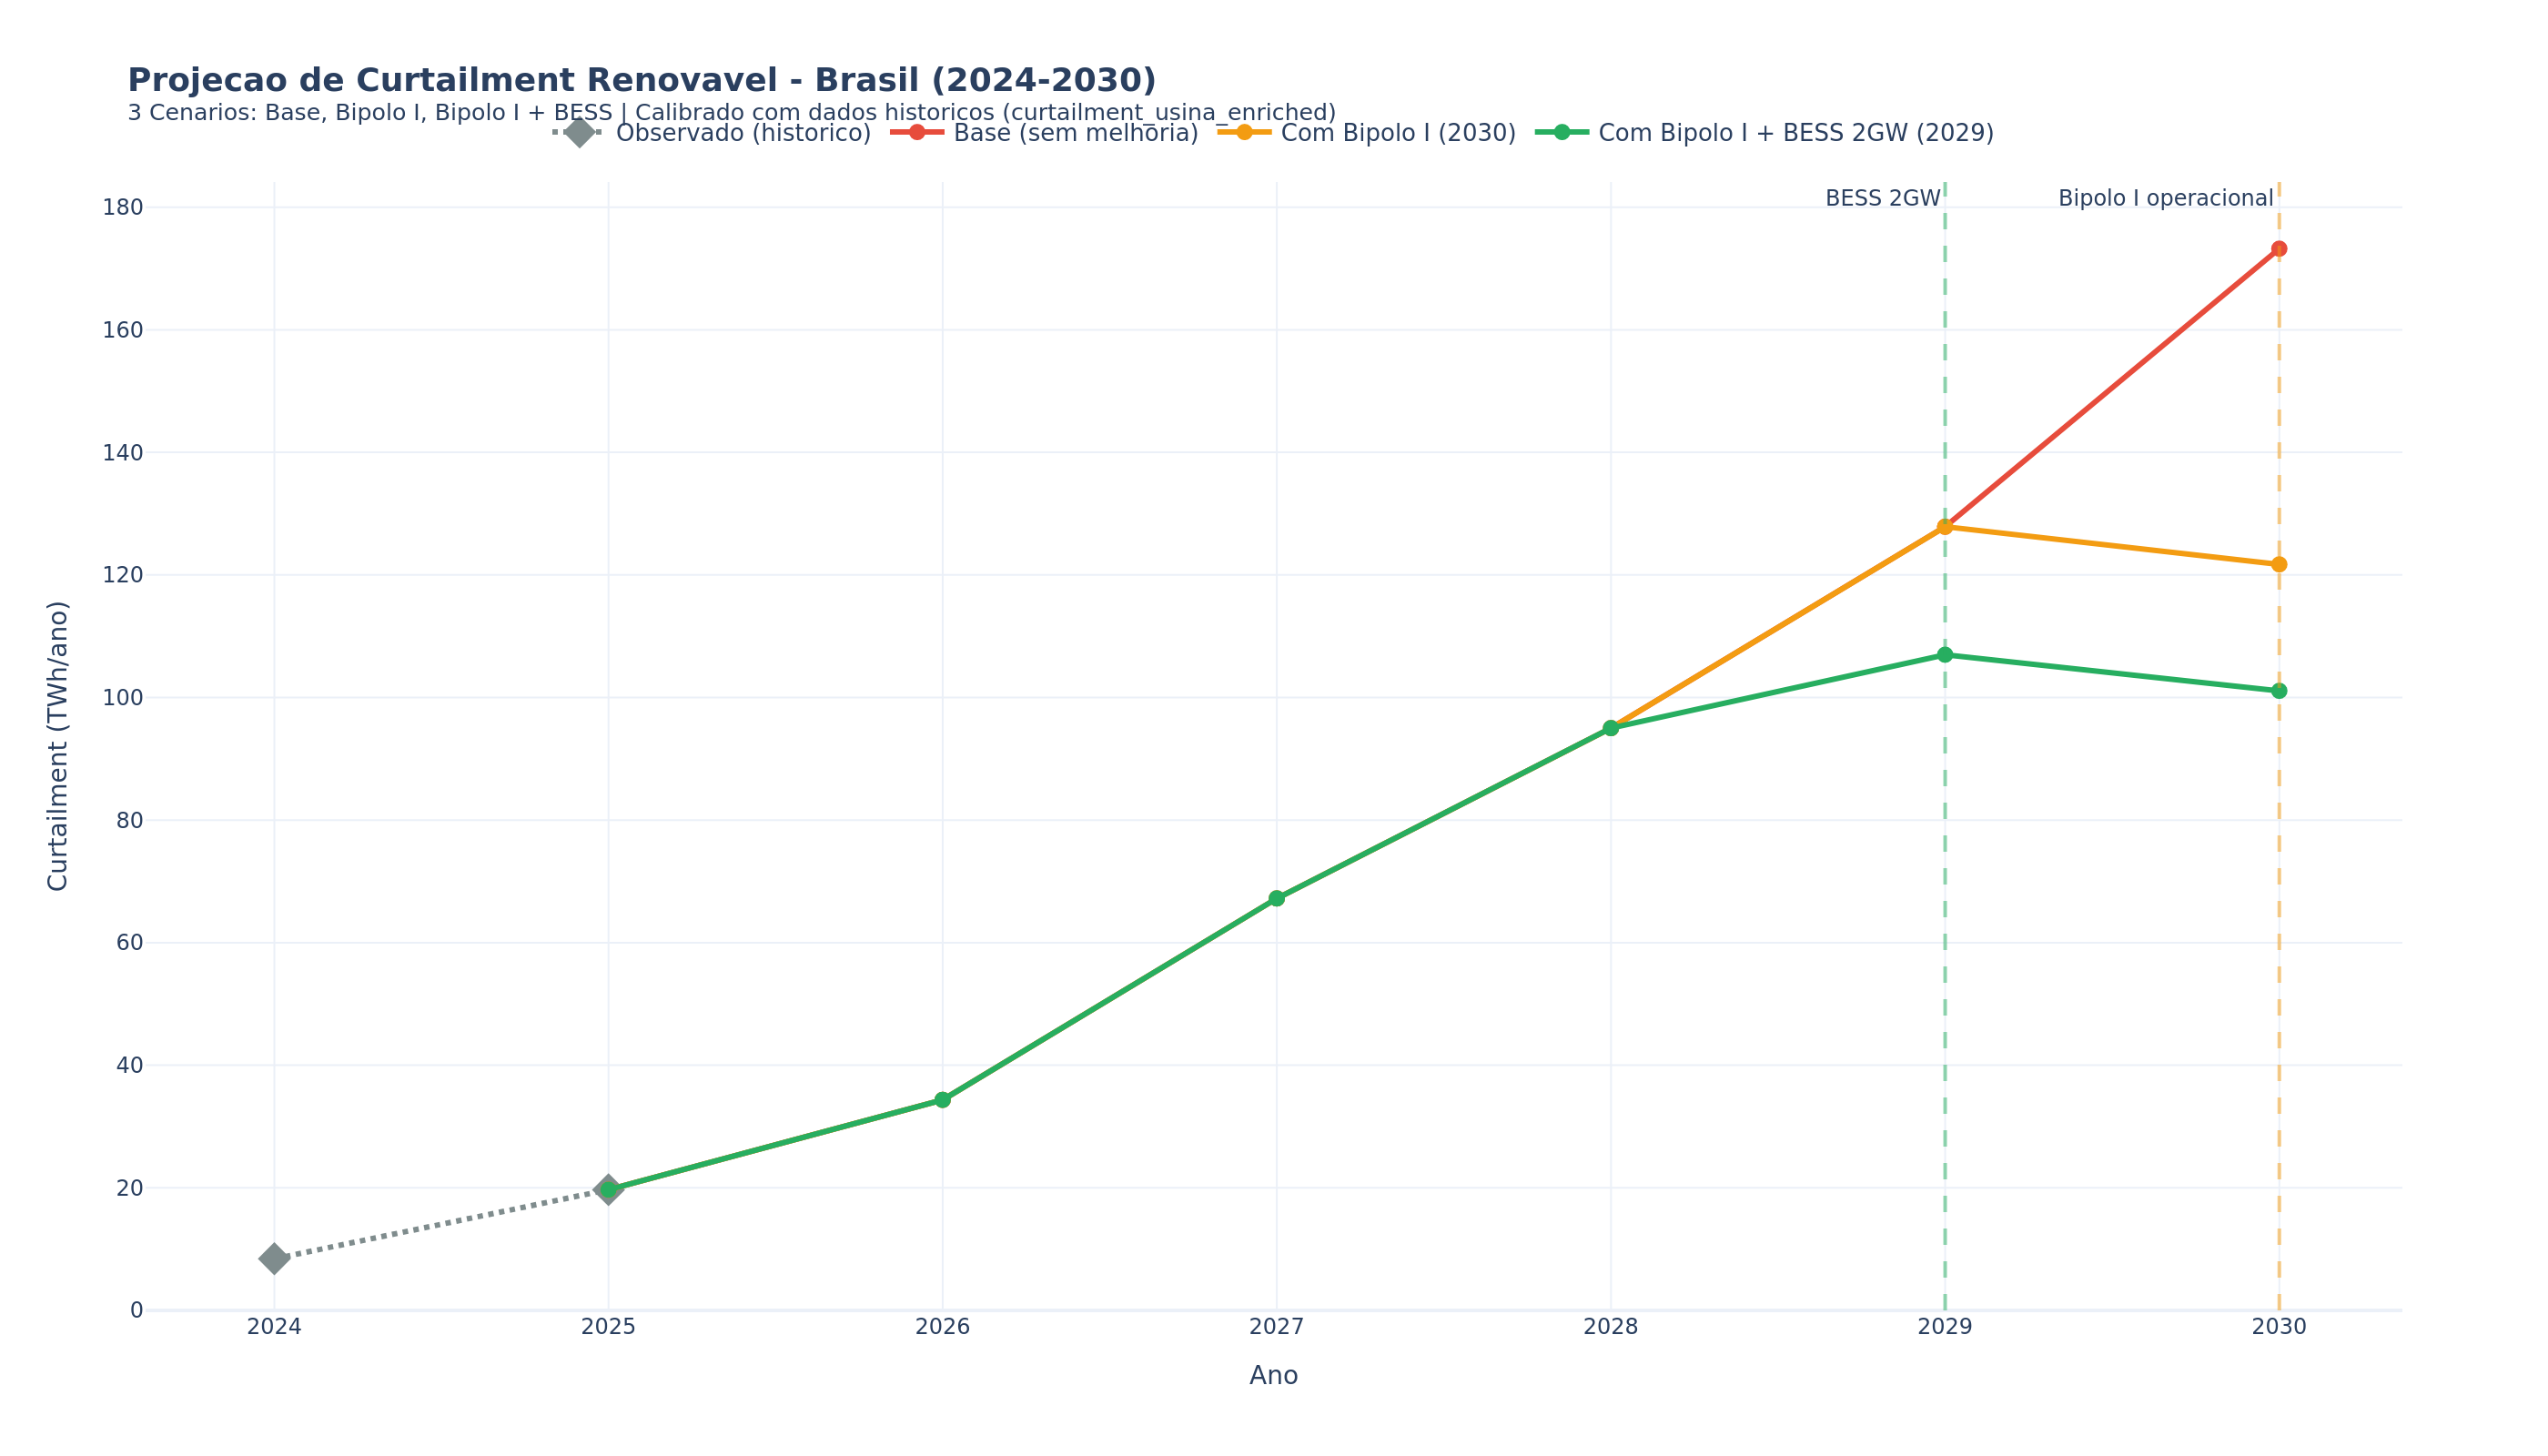
R$ 10 Billion in Clean Energy Wasted
54.5 TWh of curtailment: more than Rio de Janeiro consumes in a year