DESSEM 100% blind to curtailment
32,142 DESSEM NE records on Feb 20, 2026: ZERO scheduled wind curtailment. Input = output. The model treats renewables as 100% dispatchable.
Janauba 3 MG = 471 GWh at 2,000 km
150 Mvar synchronous compensator offline since Oct/2025 causes 471 GWh of curtailment in the NE via FNESE constraint. Cost: R$ 115M in 116 days.
Janauba counterfactual: R$ 1.1B/year
If the compensator were online, REL curtailment on the FNESE corridor would drop 85%. Projected savings: R$ 350-500M until return (Apr/2026).
MG solar: 3 independent bottlenecks
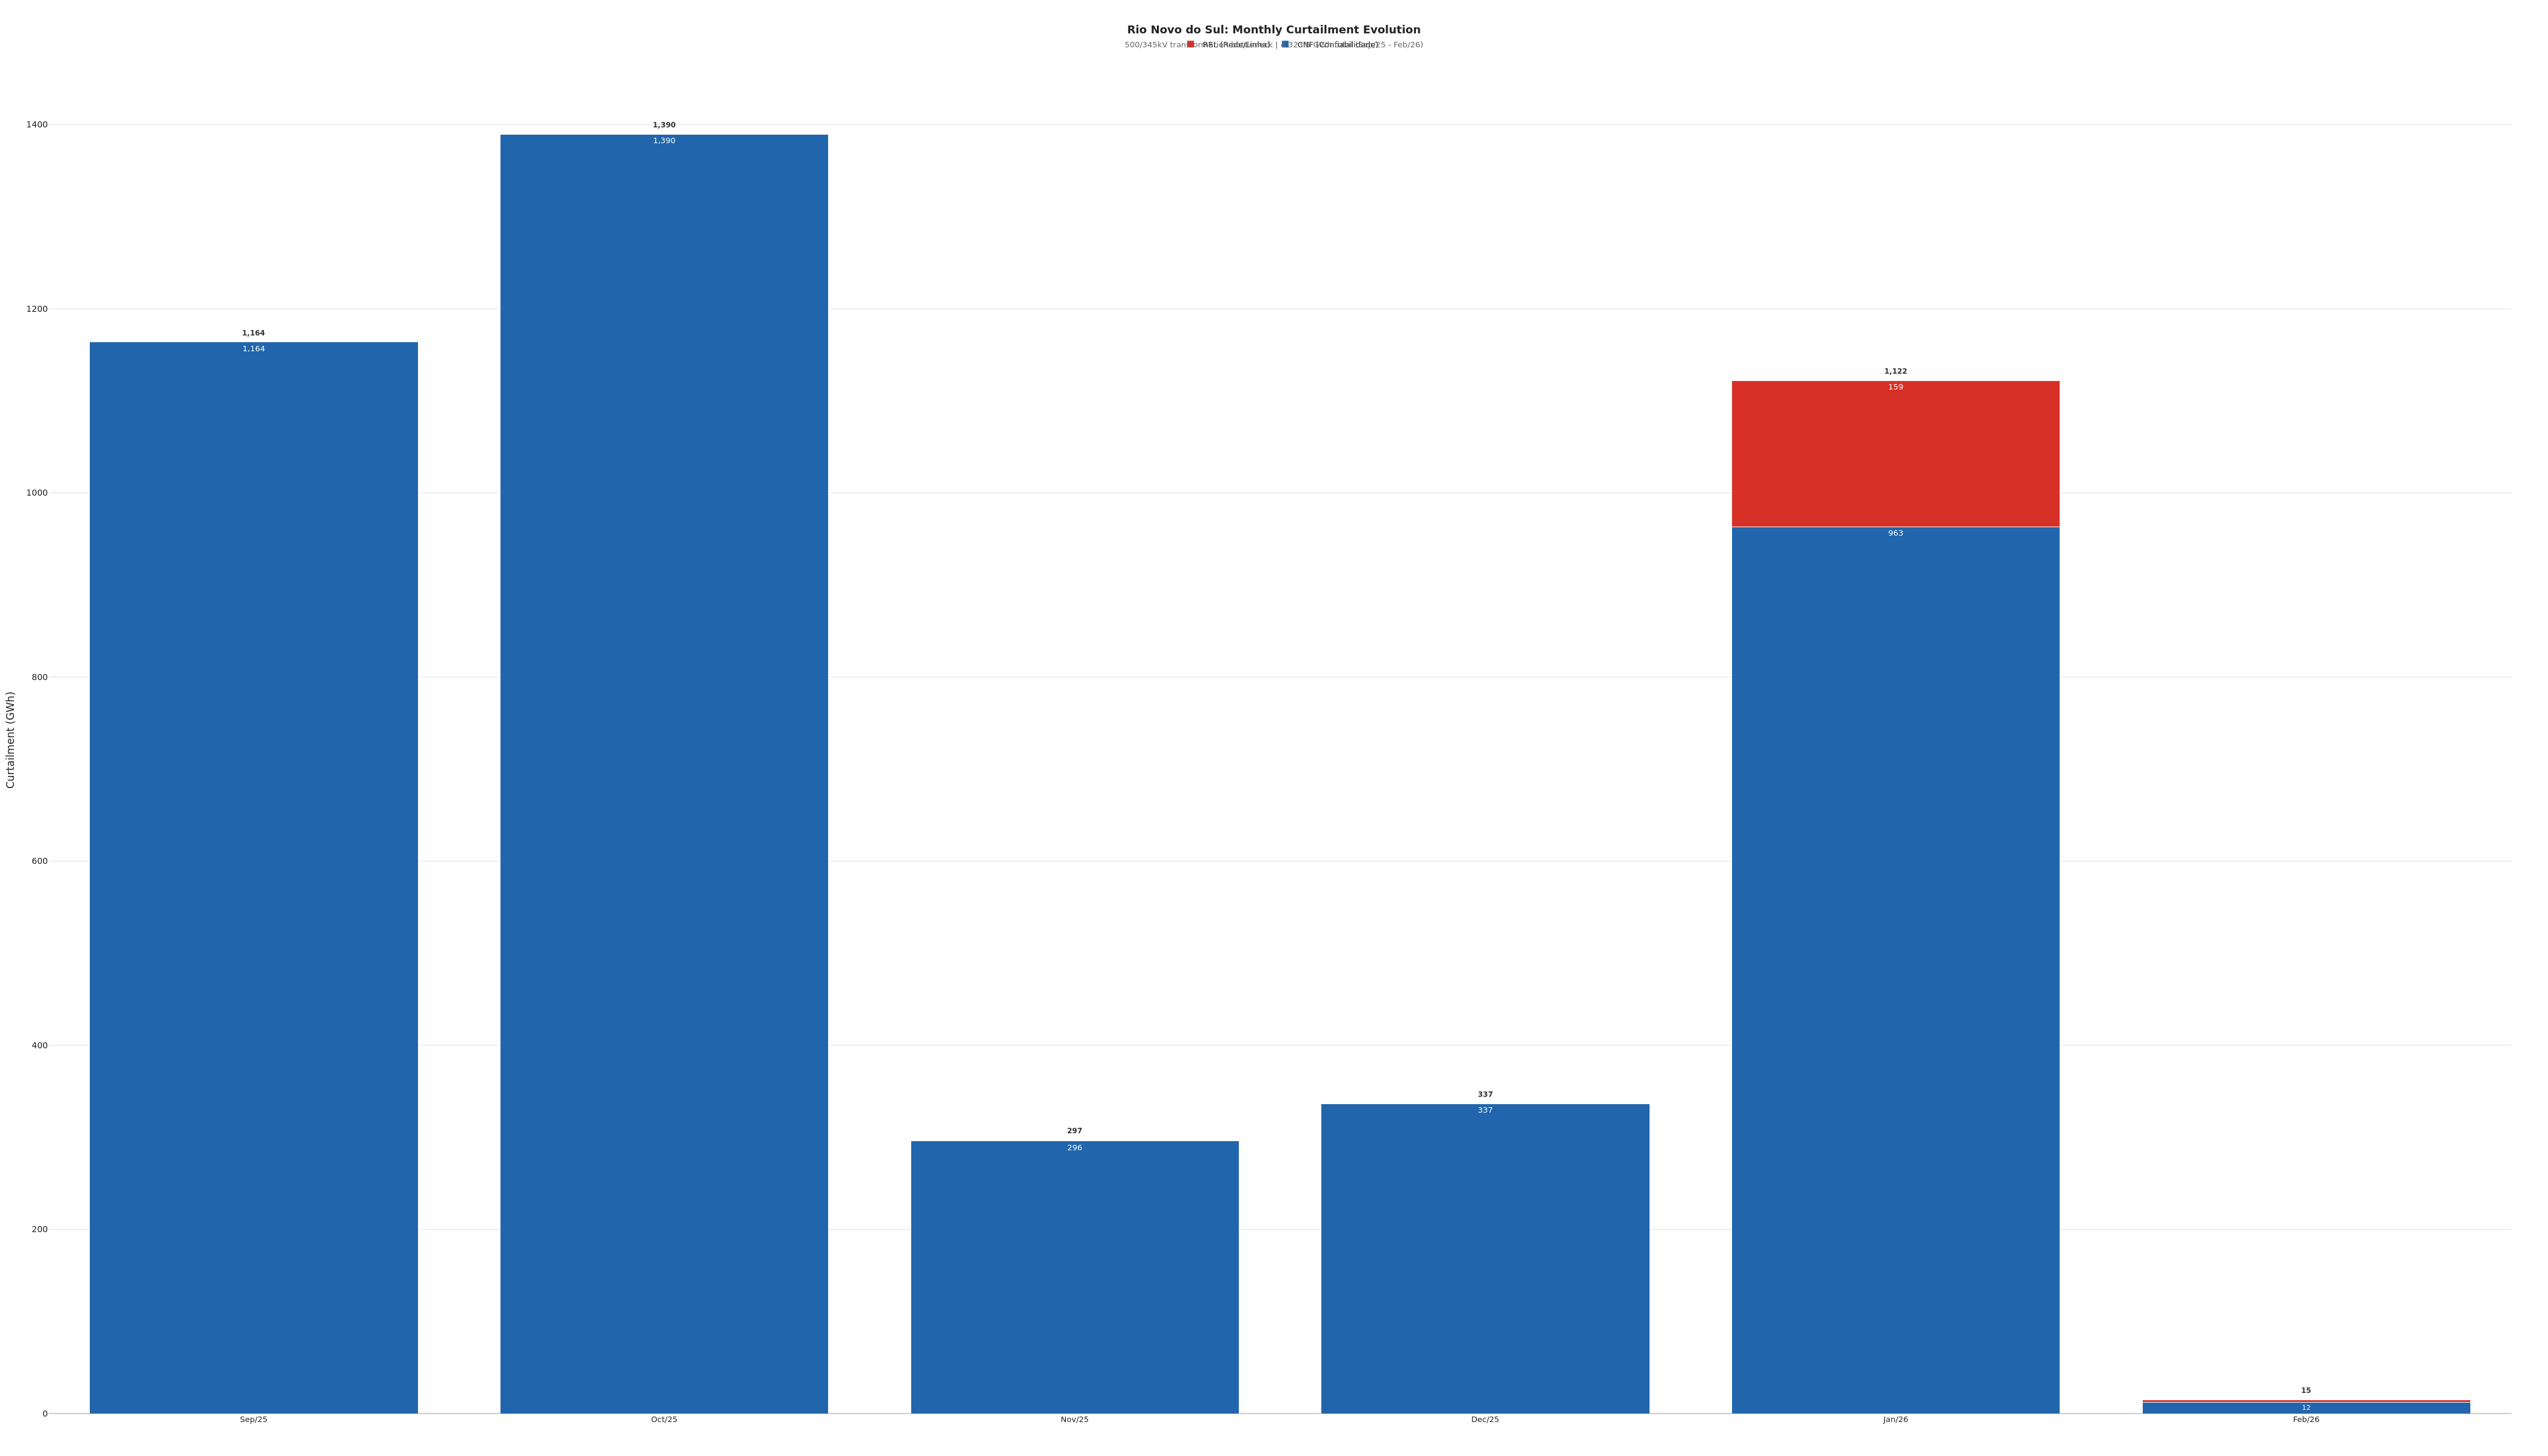
Full MG decomposition: (1) Itabira/Neves 500kV backbone, (2) Janauba-Jaiba 230kV corridor, (3) Rio Novo do Sul (shared with NE). 43.2% with specific attribution.
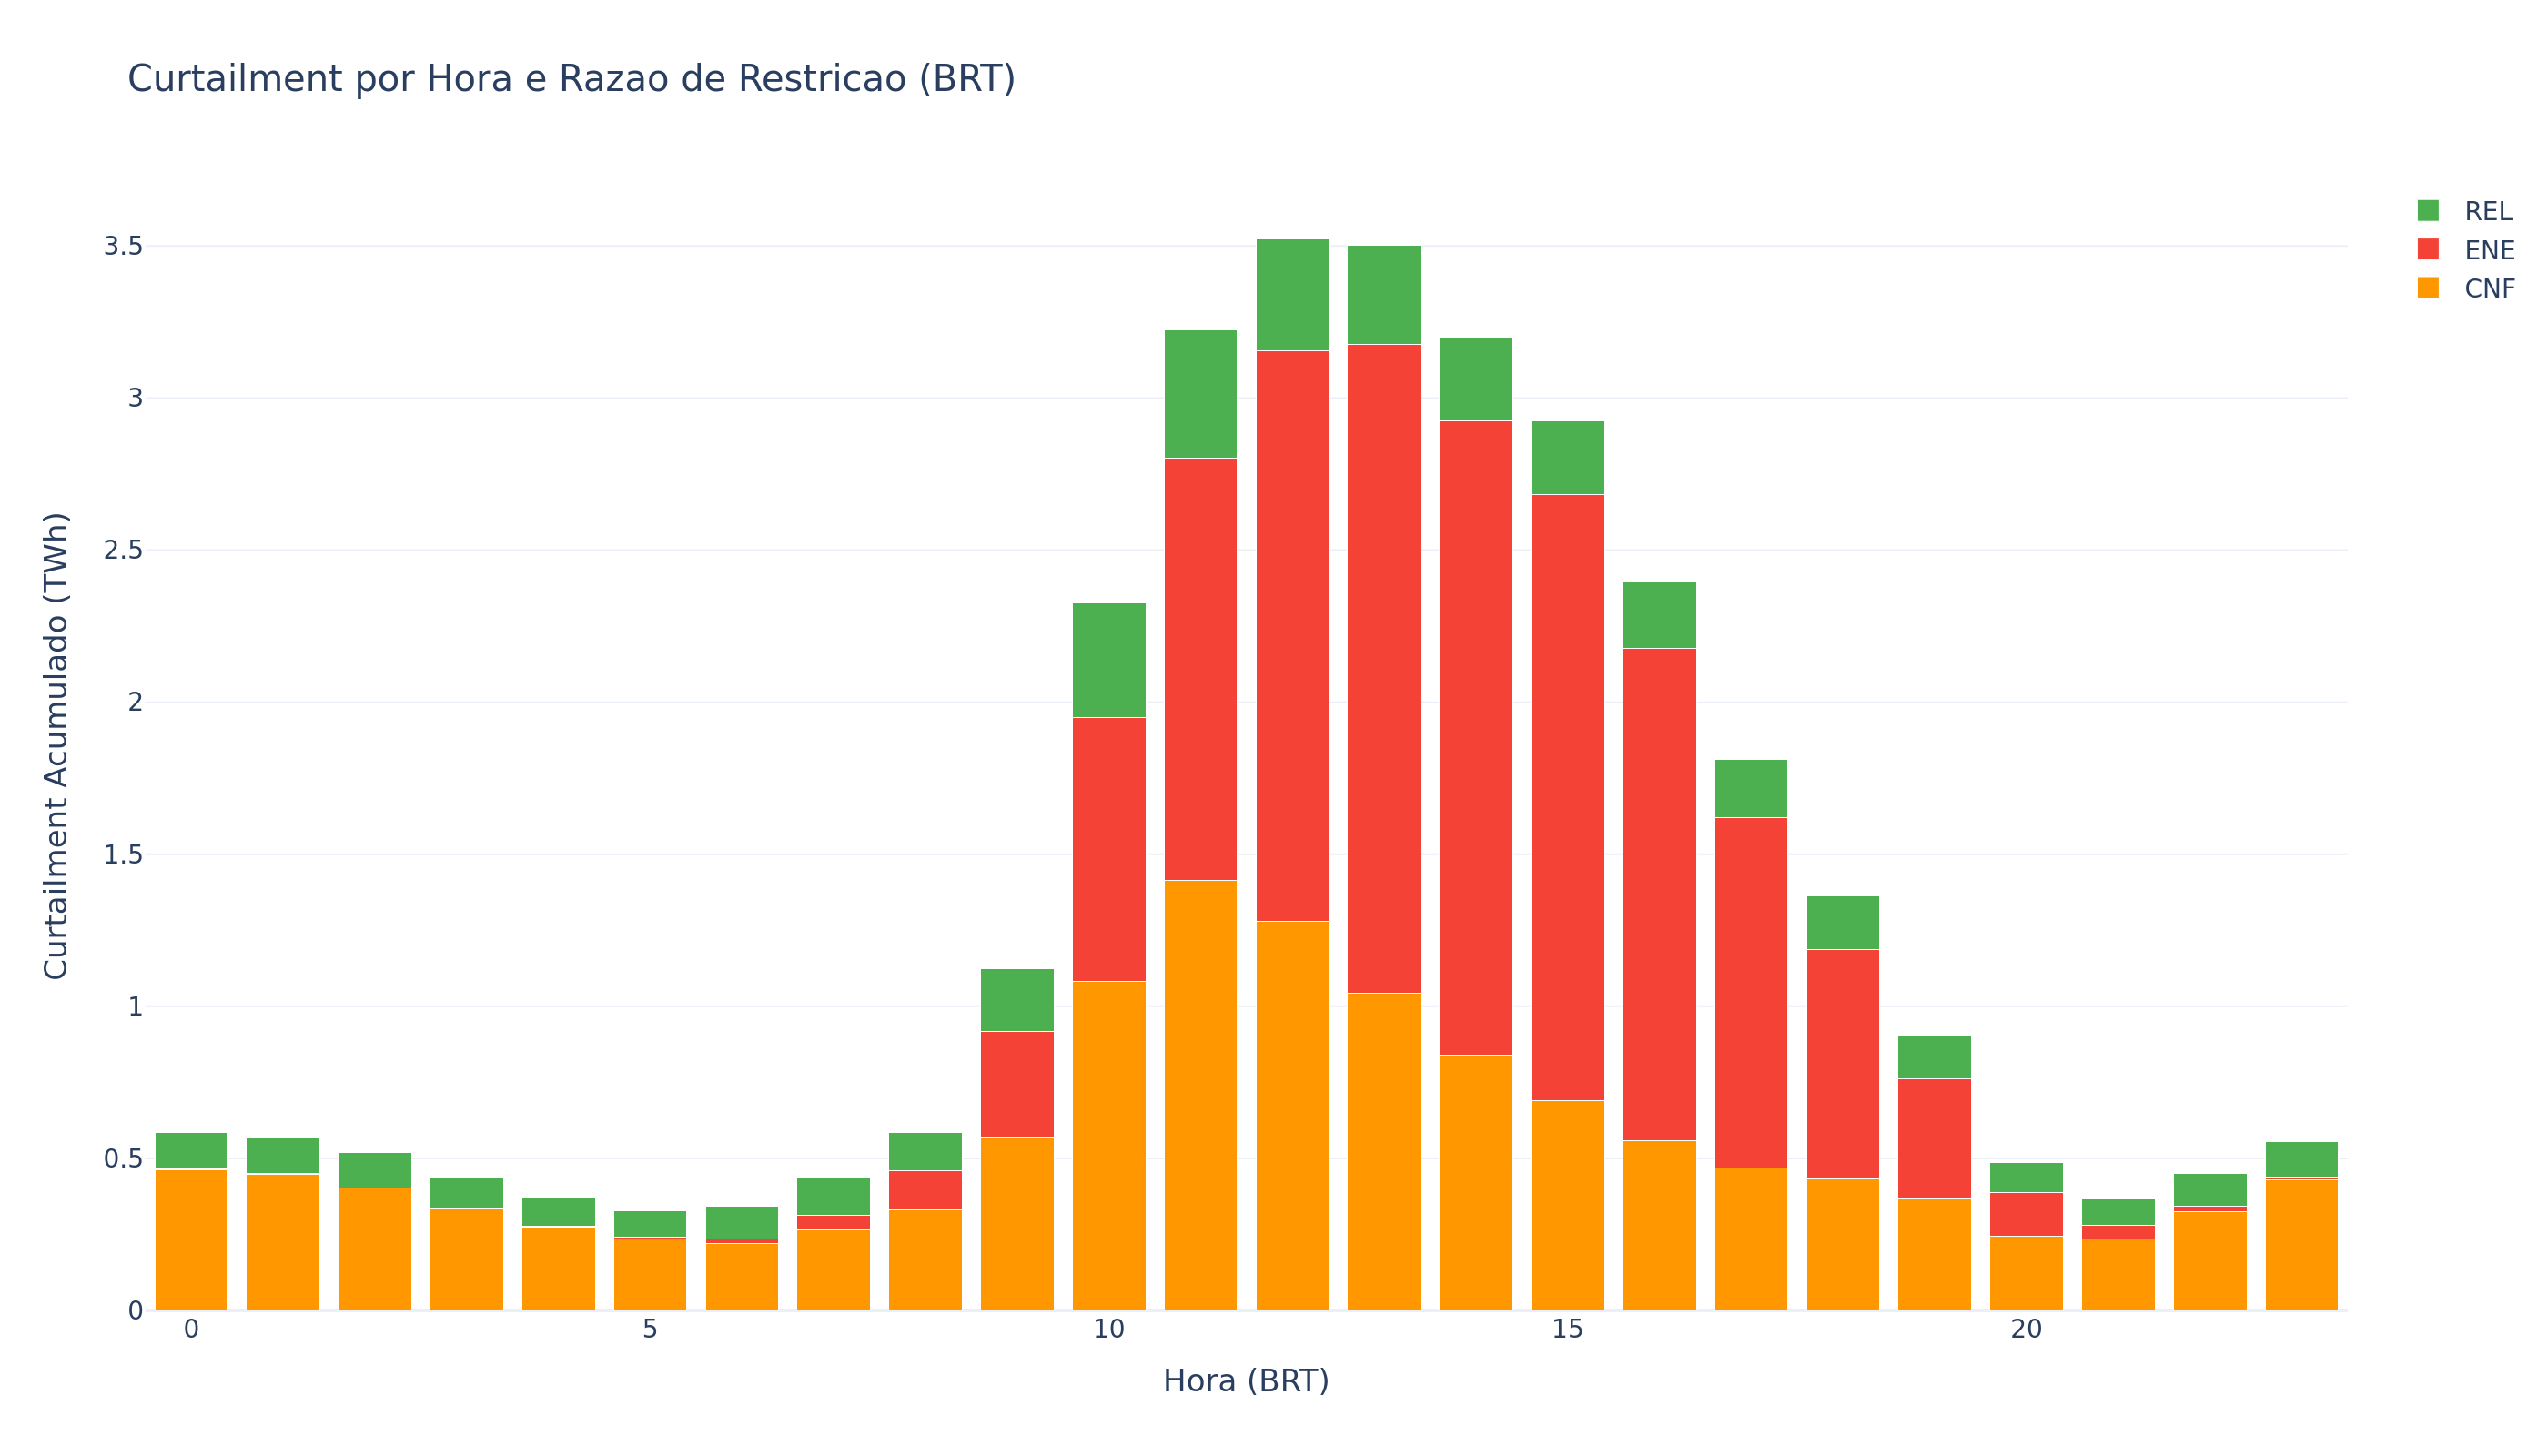
Weekend bias: +44%/day
Curtailment per day is 44% higher on weekends (132.2 vs 91.8 GWh/day). CNF drops 60% on weekends, ENE rises 72%. Generators penalized when system has more slack.
P10 jumped 27x: curtailment became baseload
Daily floor (P10) of curtailment: 455 MWh/day (2024) to 12,089 MWh/day (2025). CV dropped 27% (0.949 to 0.692). 41% of days with curtailment in all 24 hours.
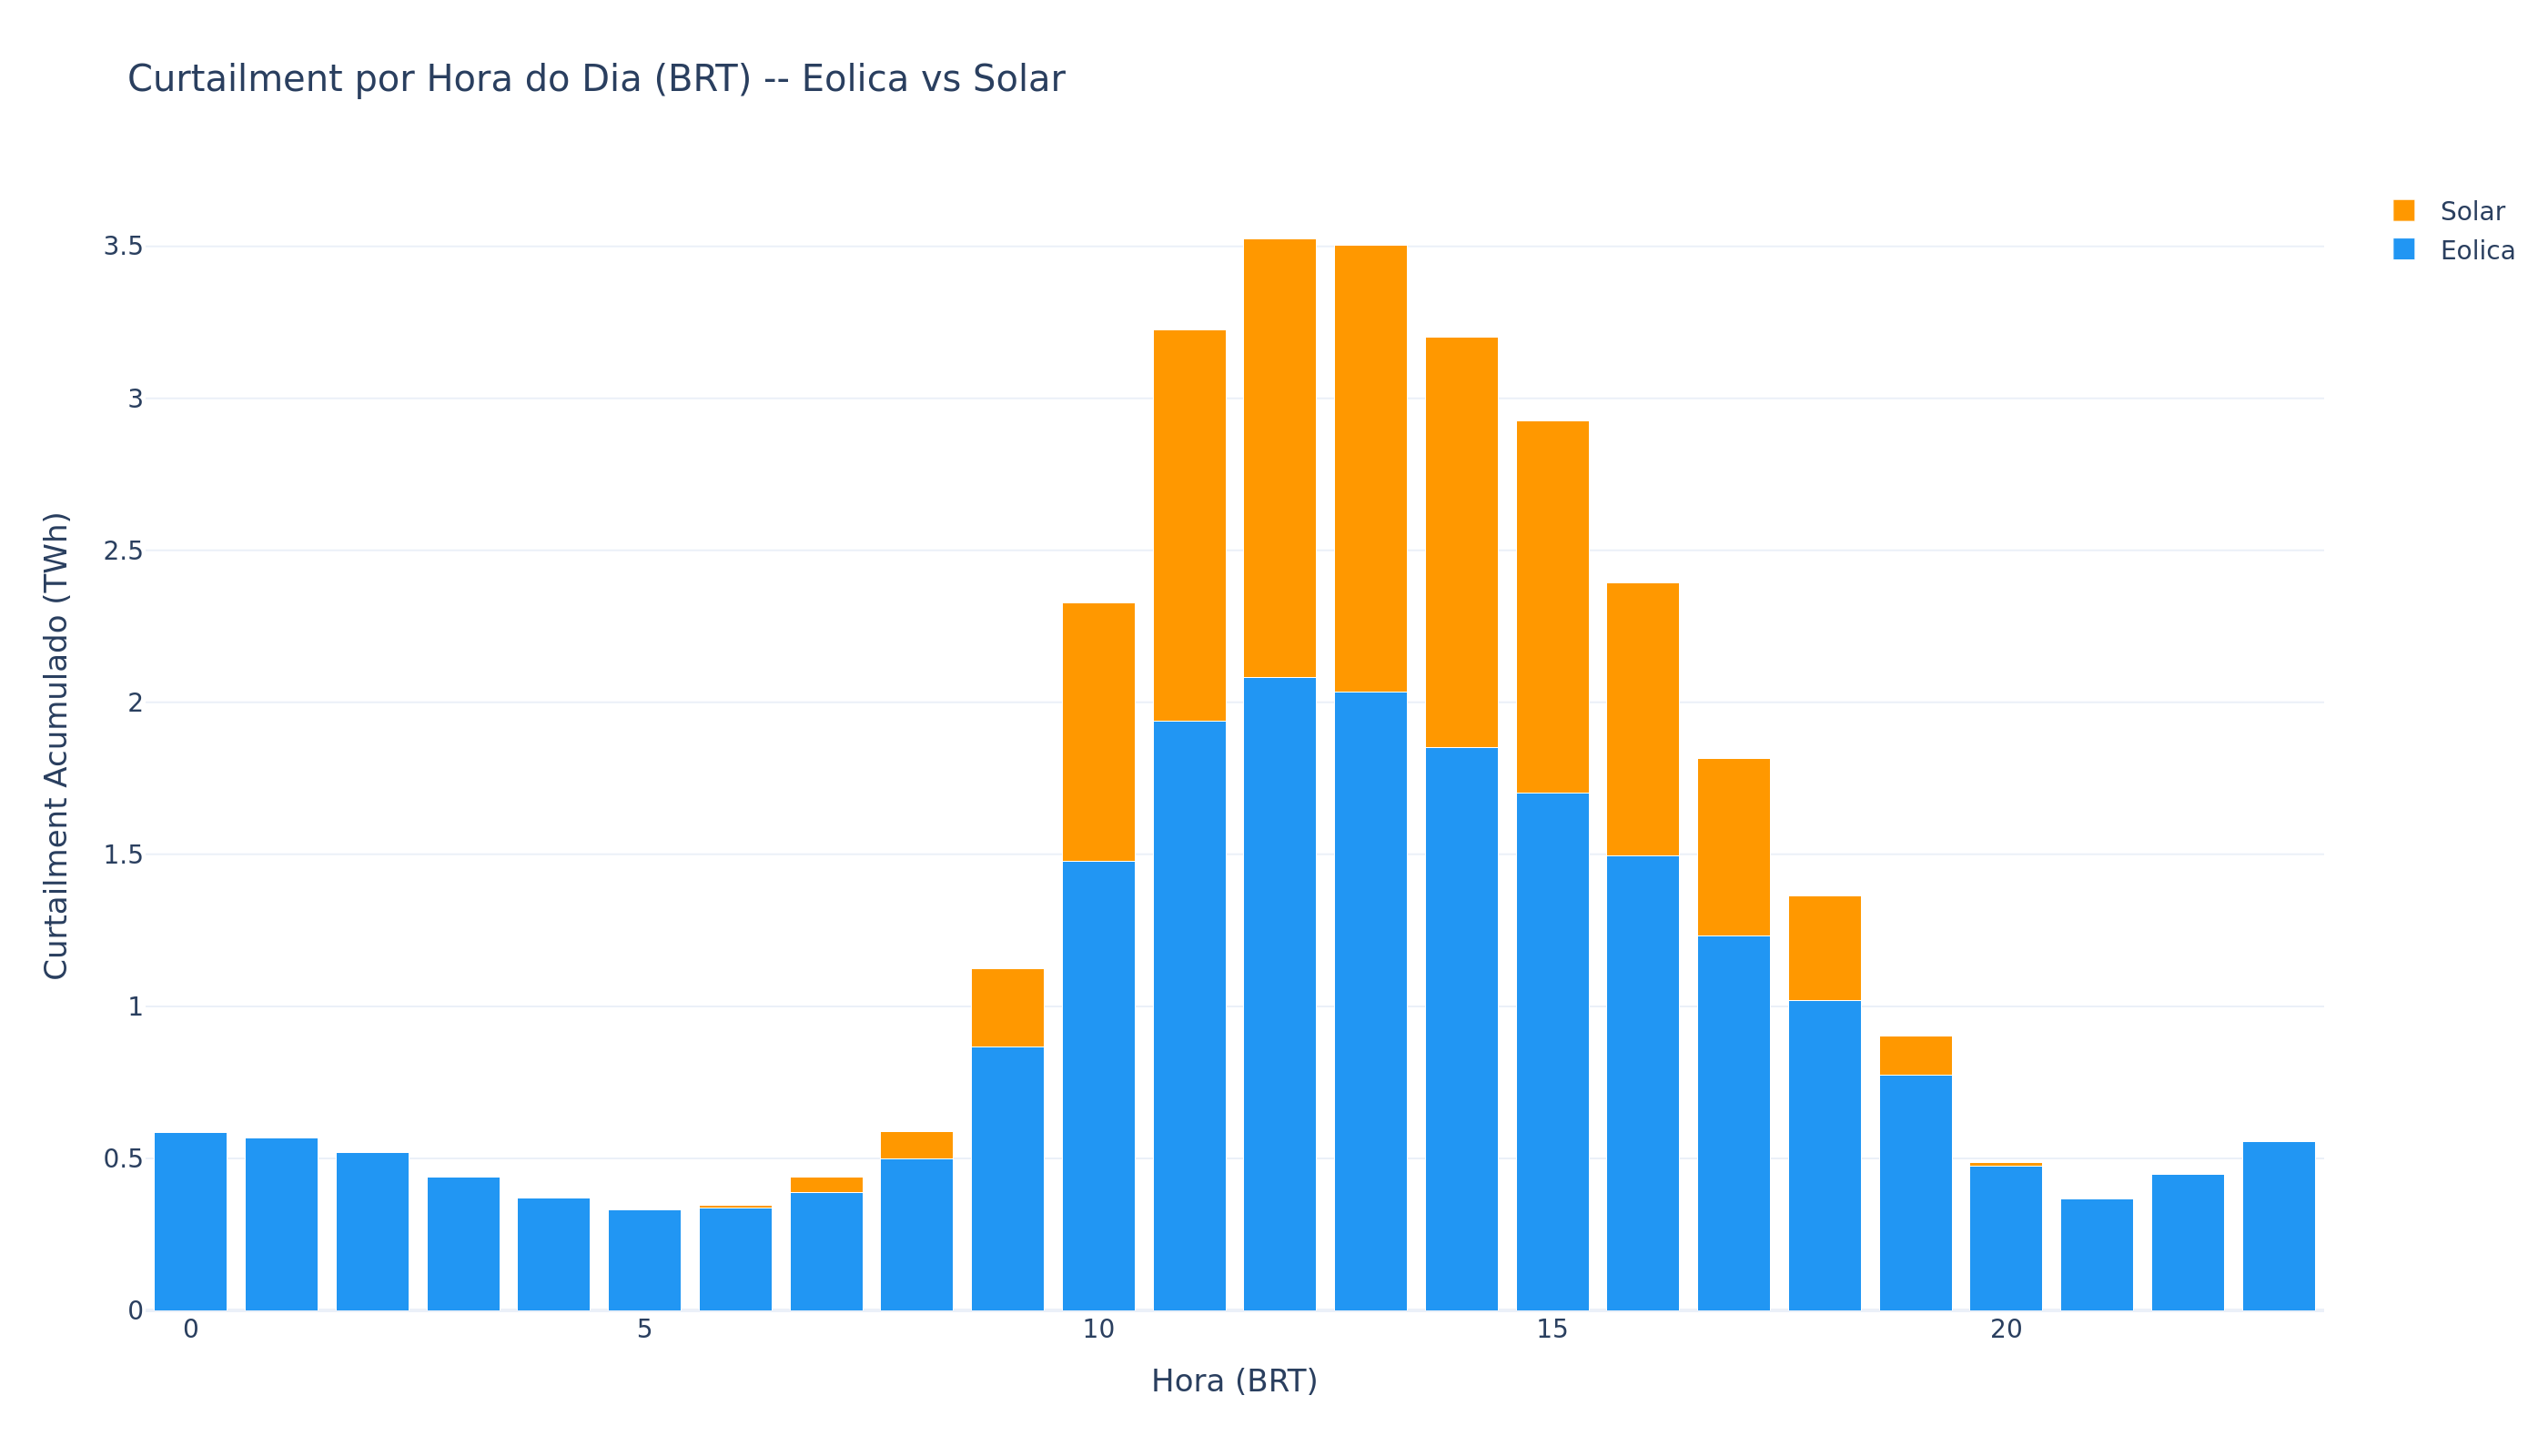
Curtailment present 99% of hours
Average of 20.2 hours/day with curtailment in 2025. Only 1% of hours free. It is no longer an event -- it is a permanent state of the system.
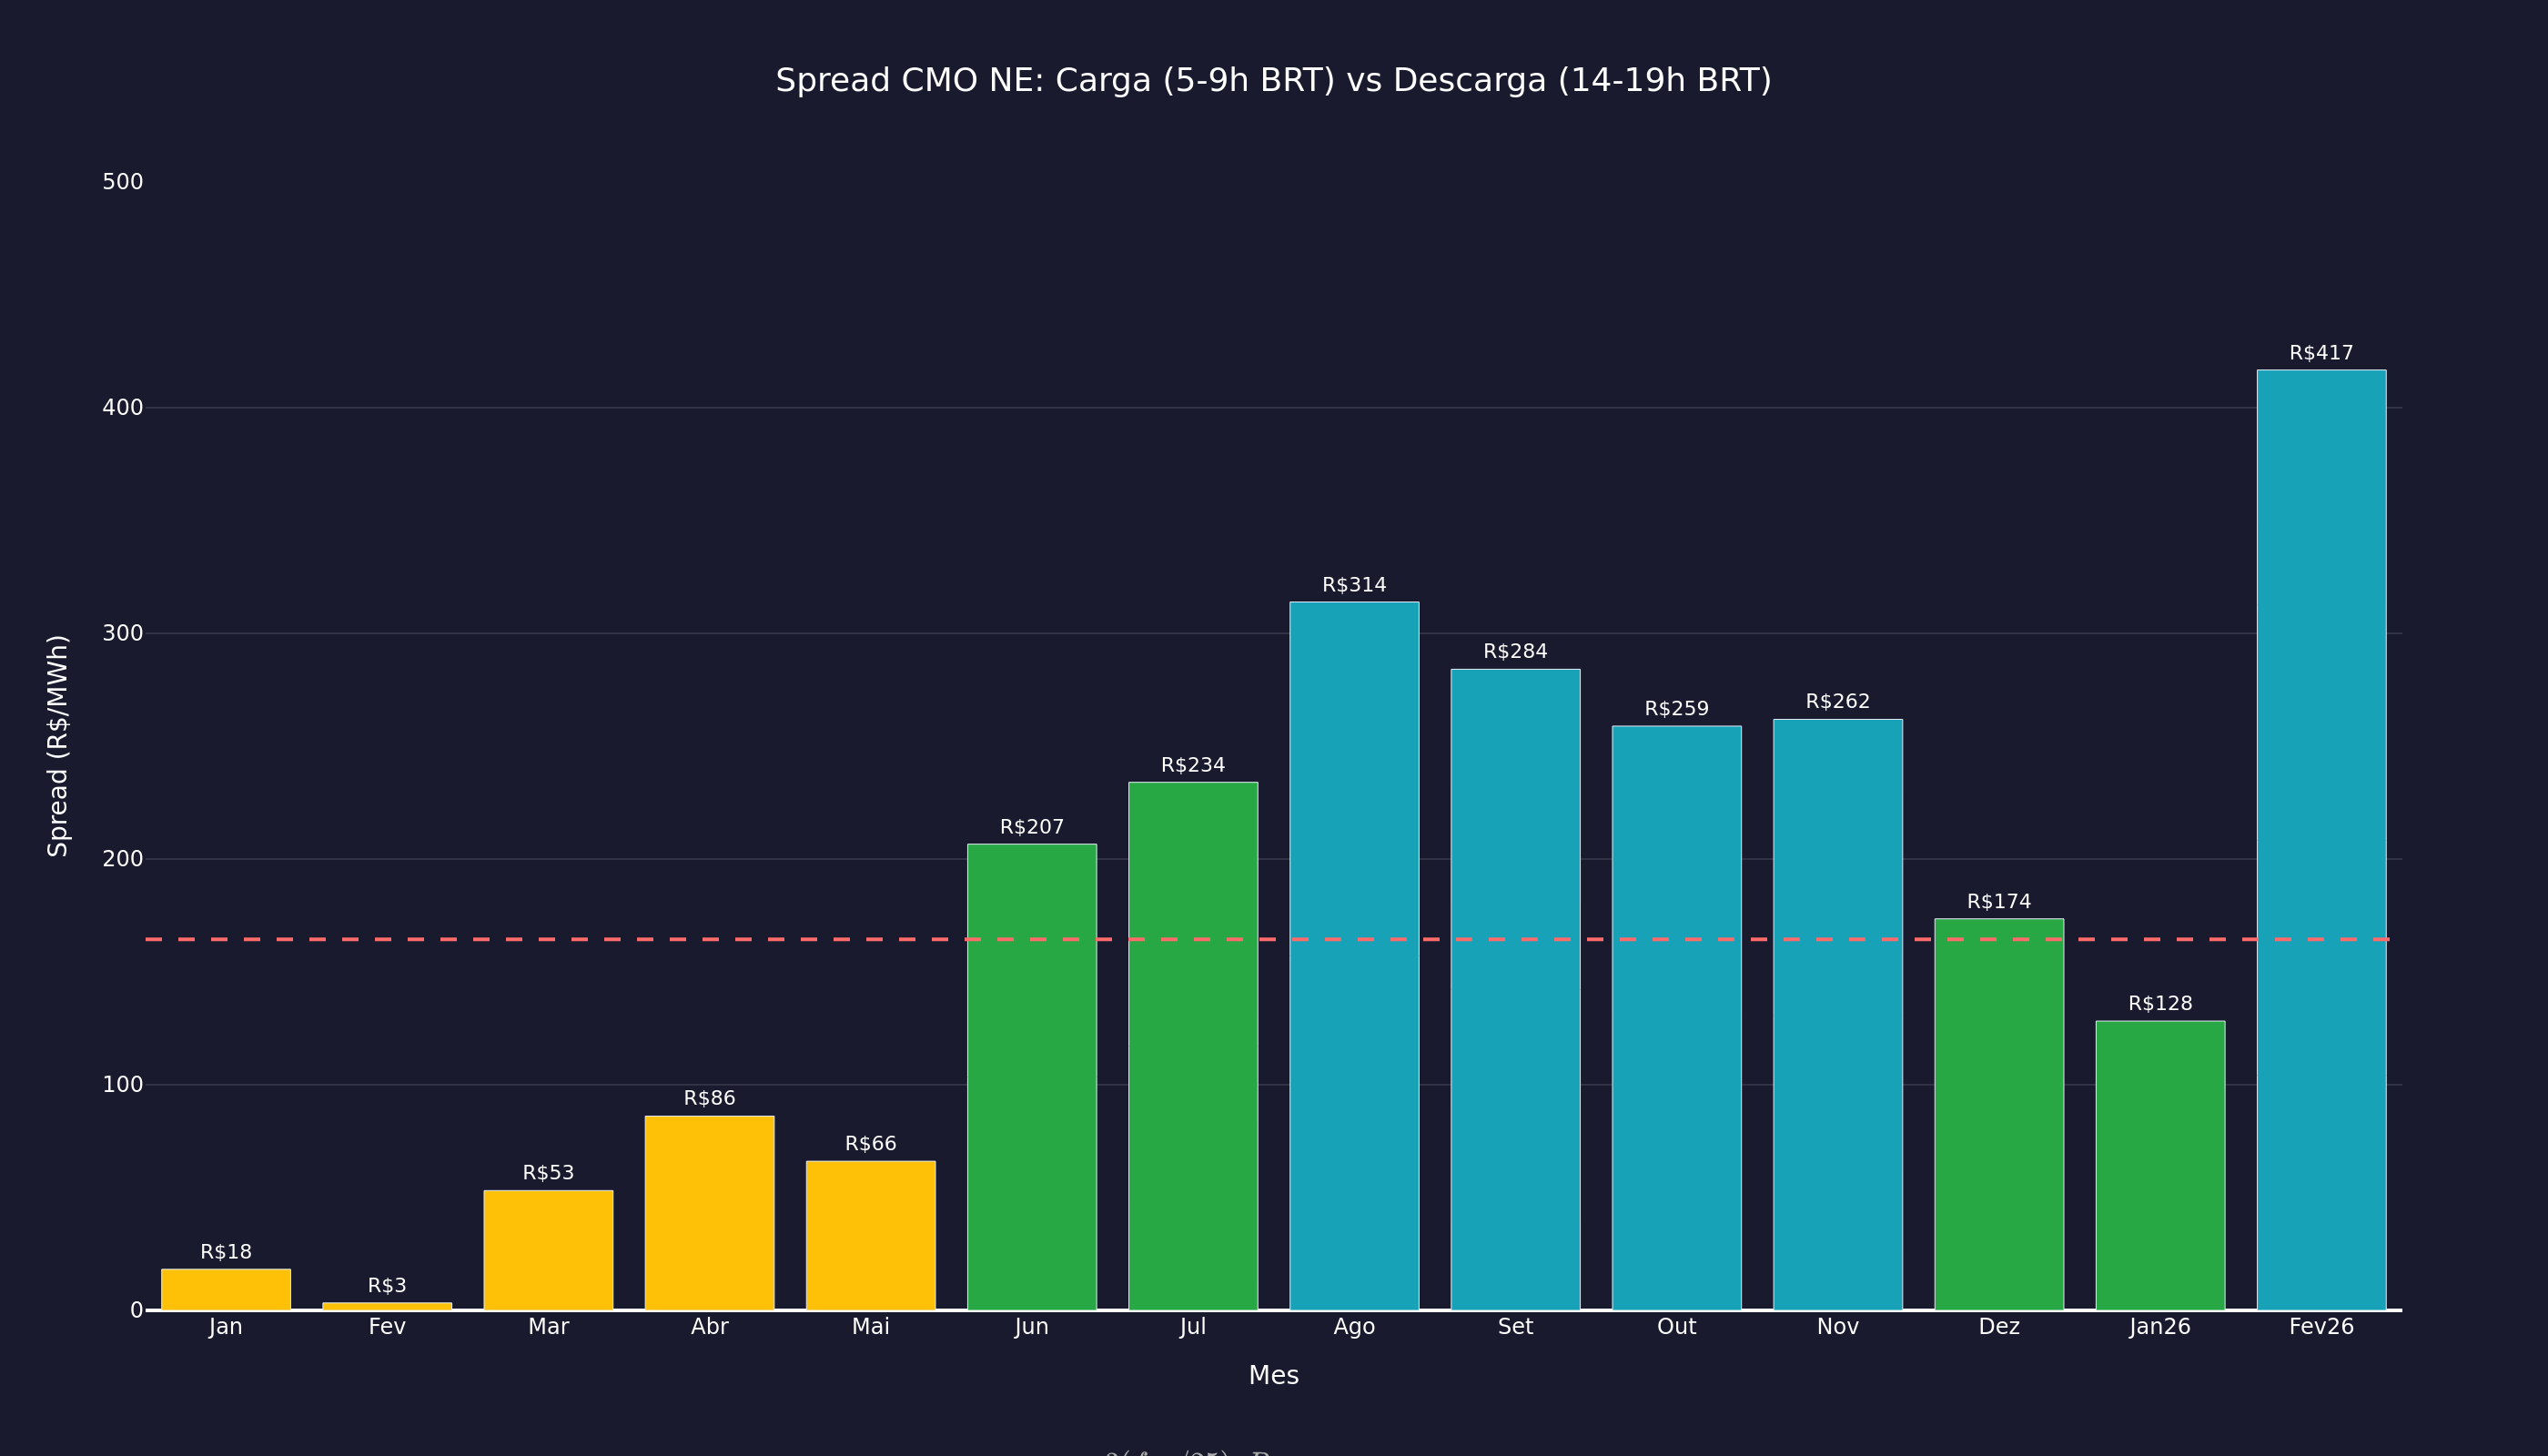
BESS value 2.4x higher than volume
Optimal window by volume: 07-10 BRT (4,295 GWh, R$ 447M). By value: 12-15 BRT (2,497 GWh, R$ 2,497M). CMO spread R$ 176/MWh. 2.4x more revenue shifting 3h.
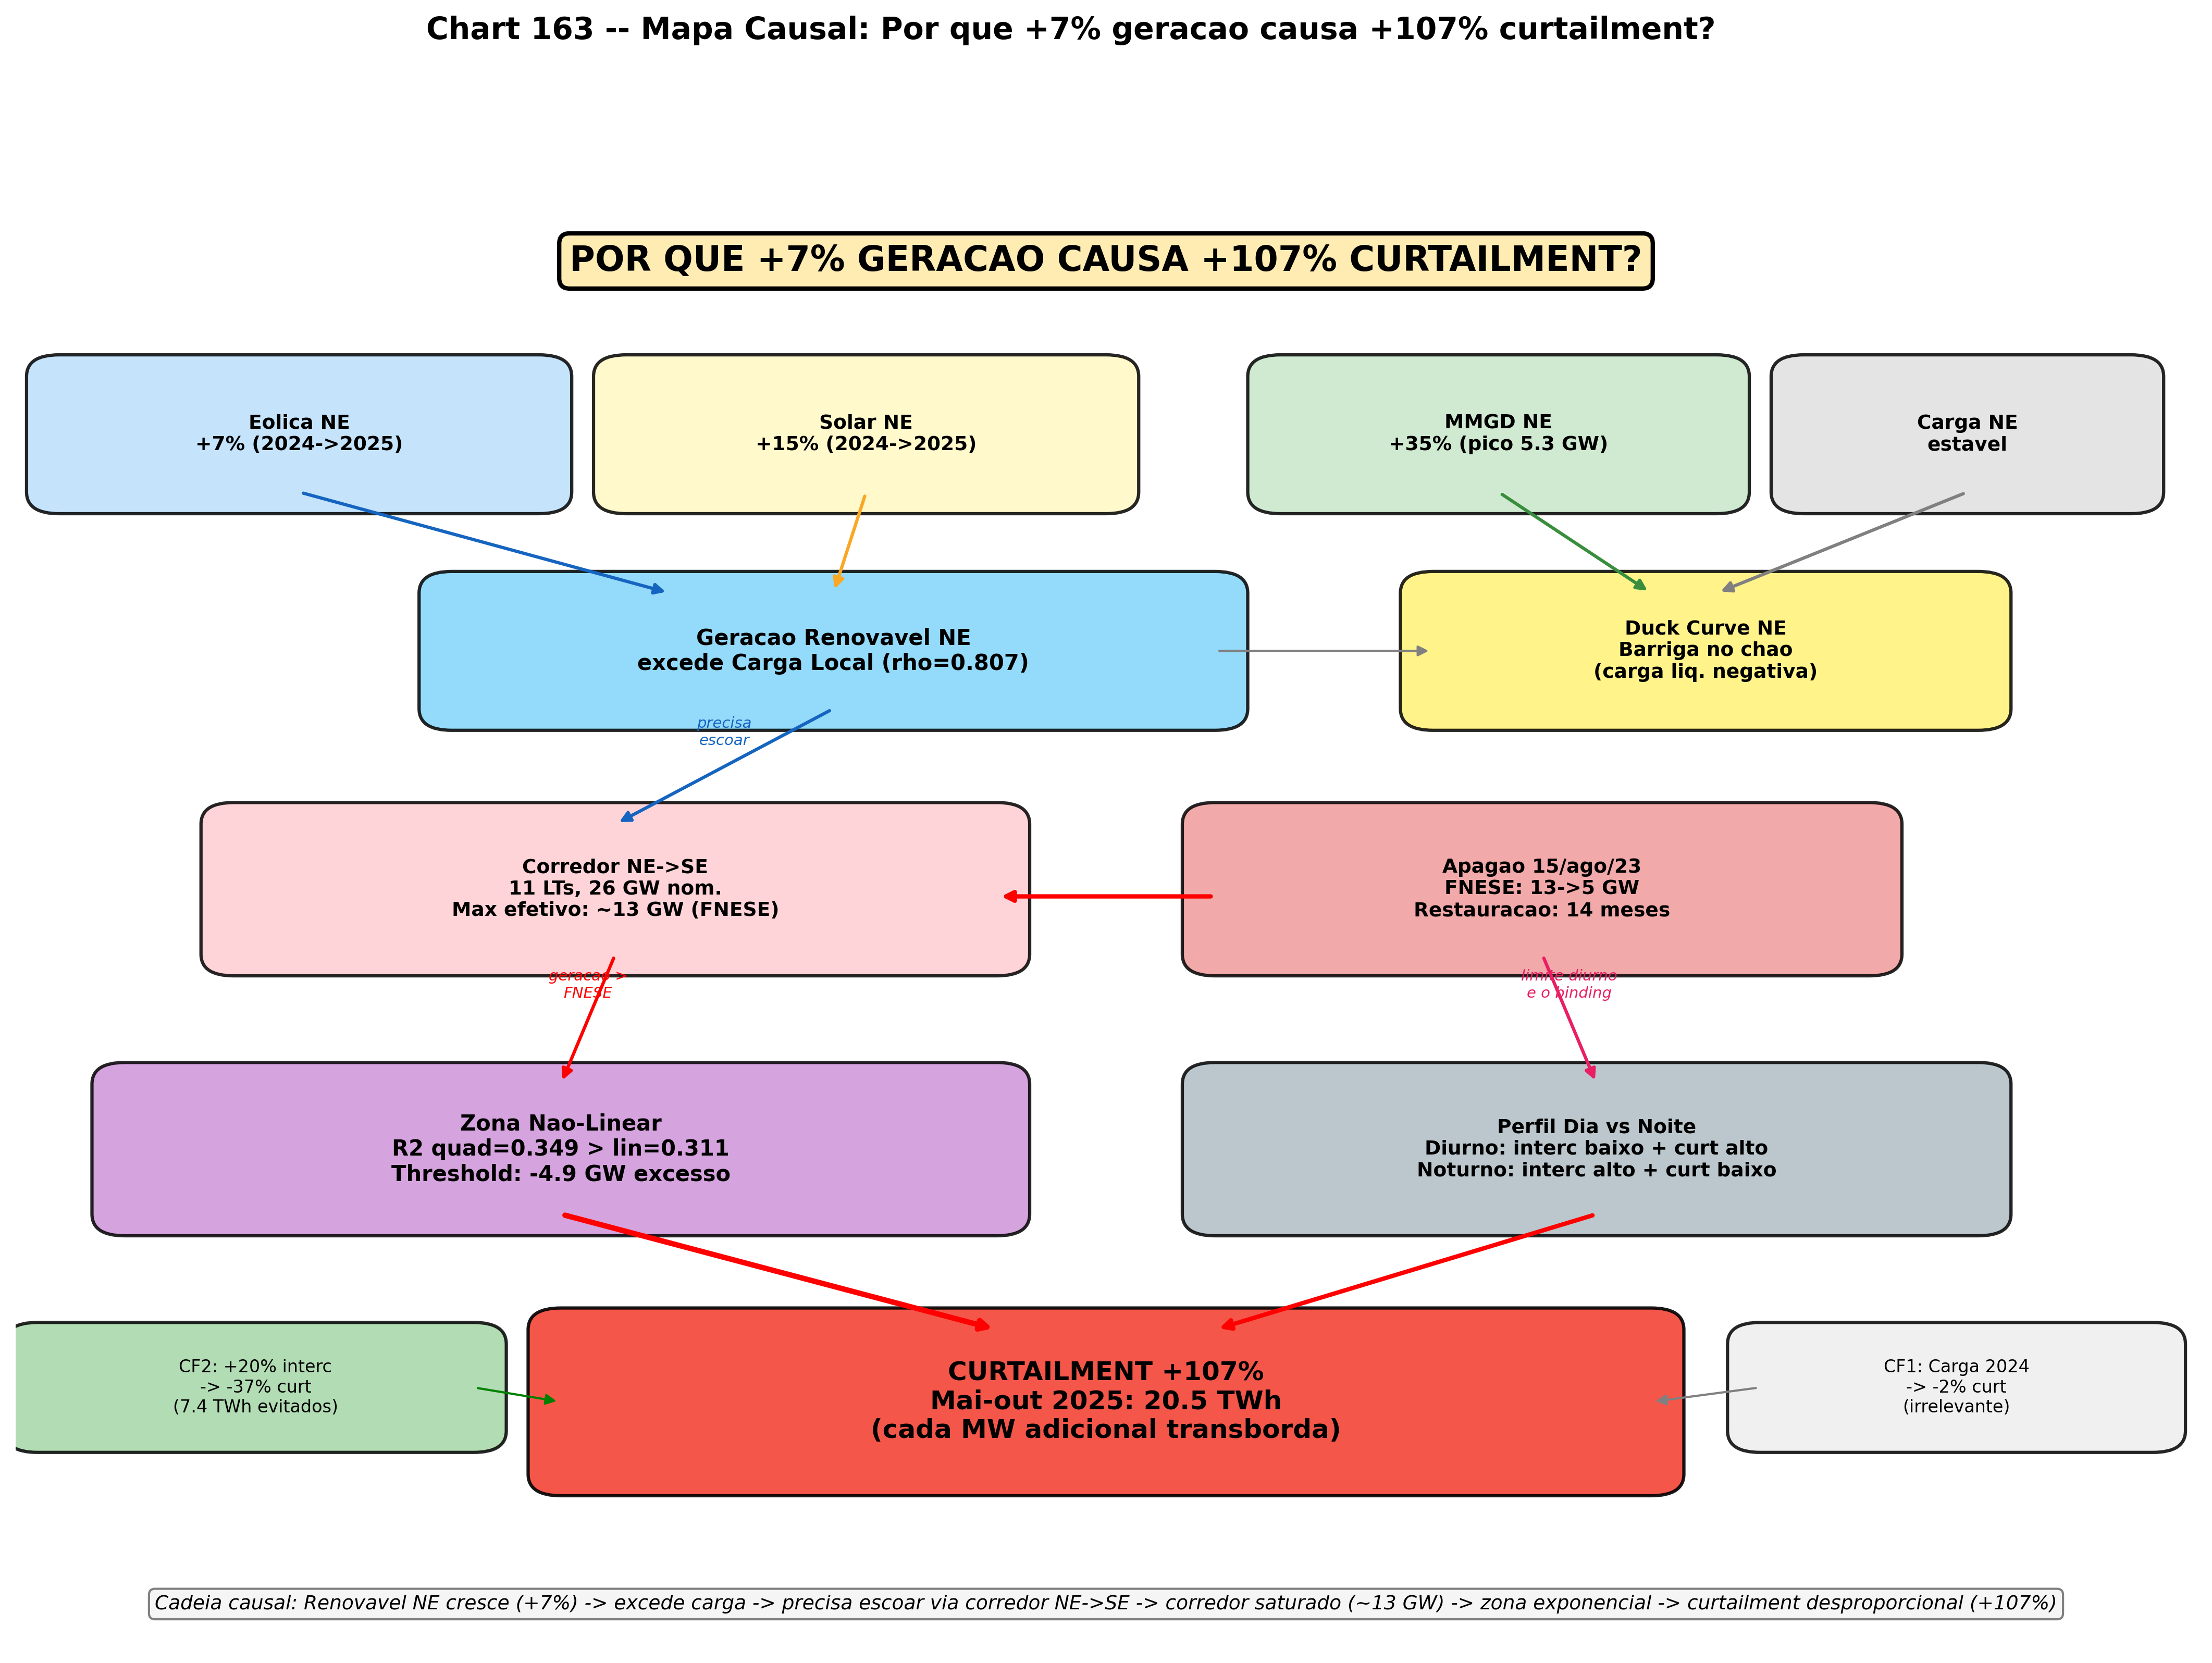
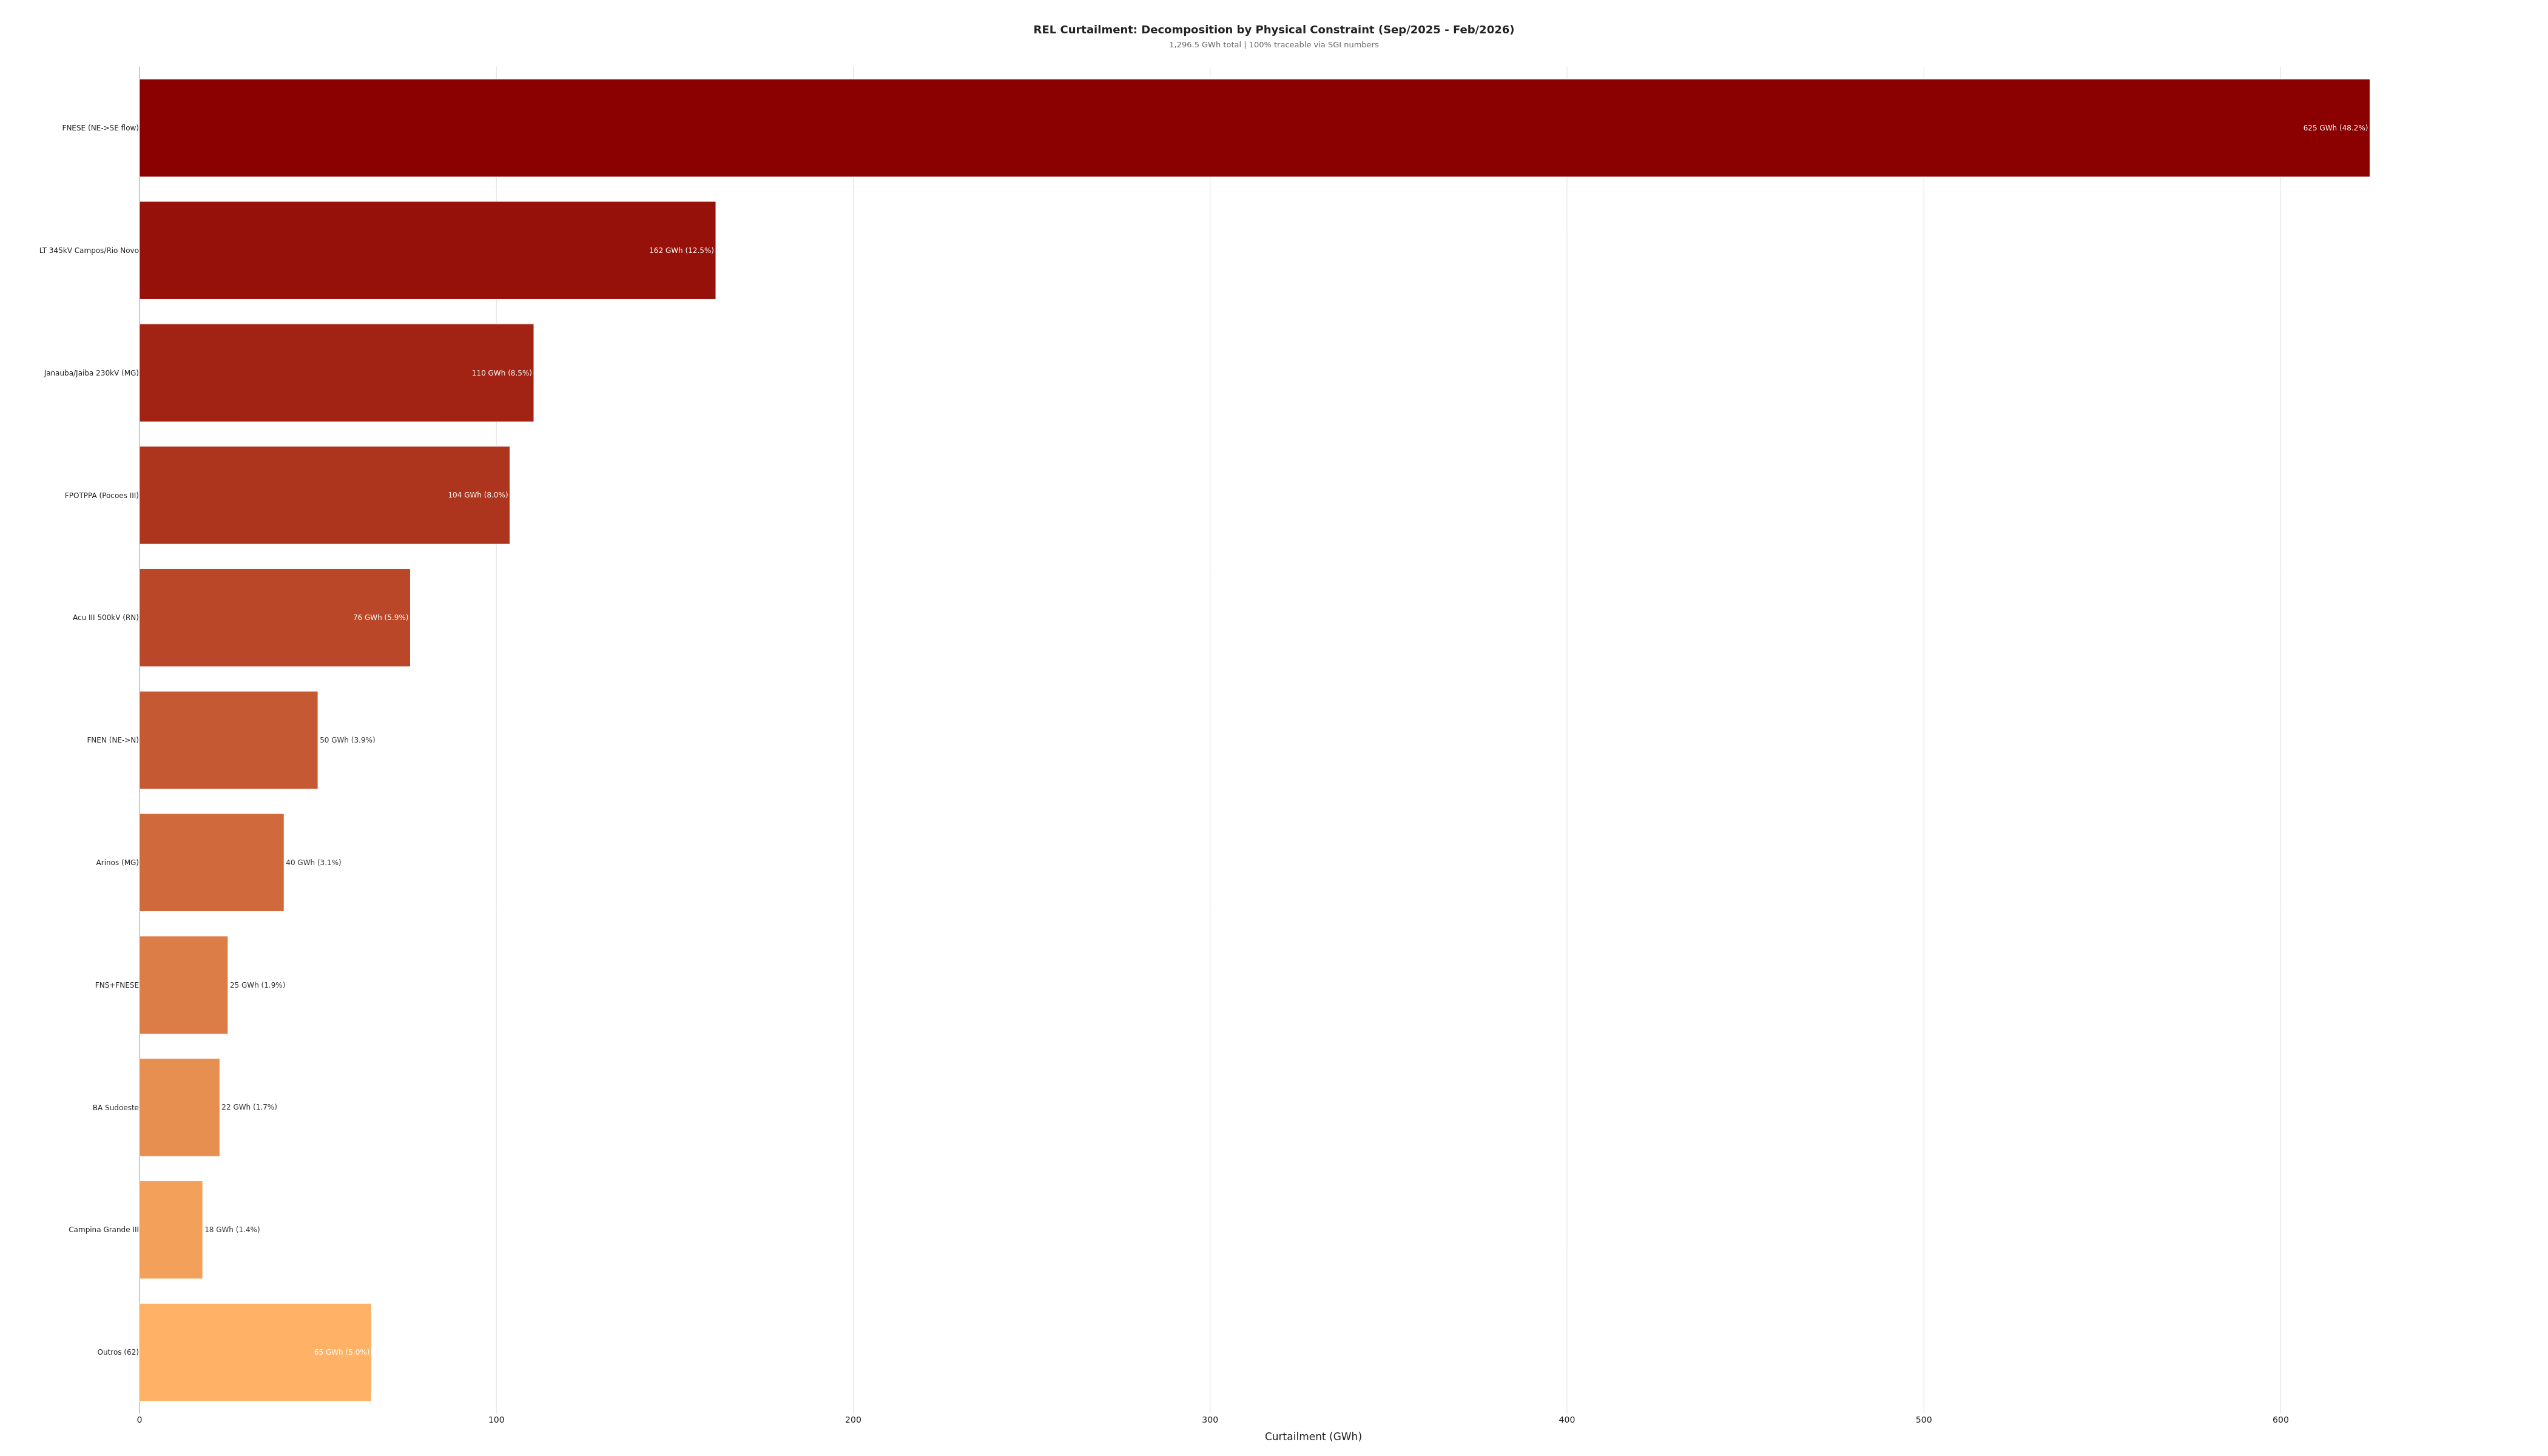
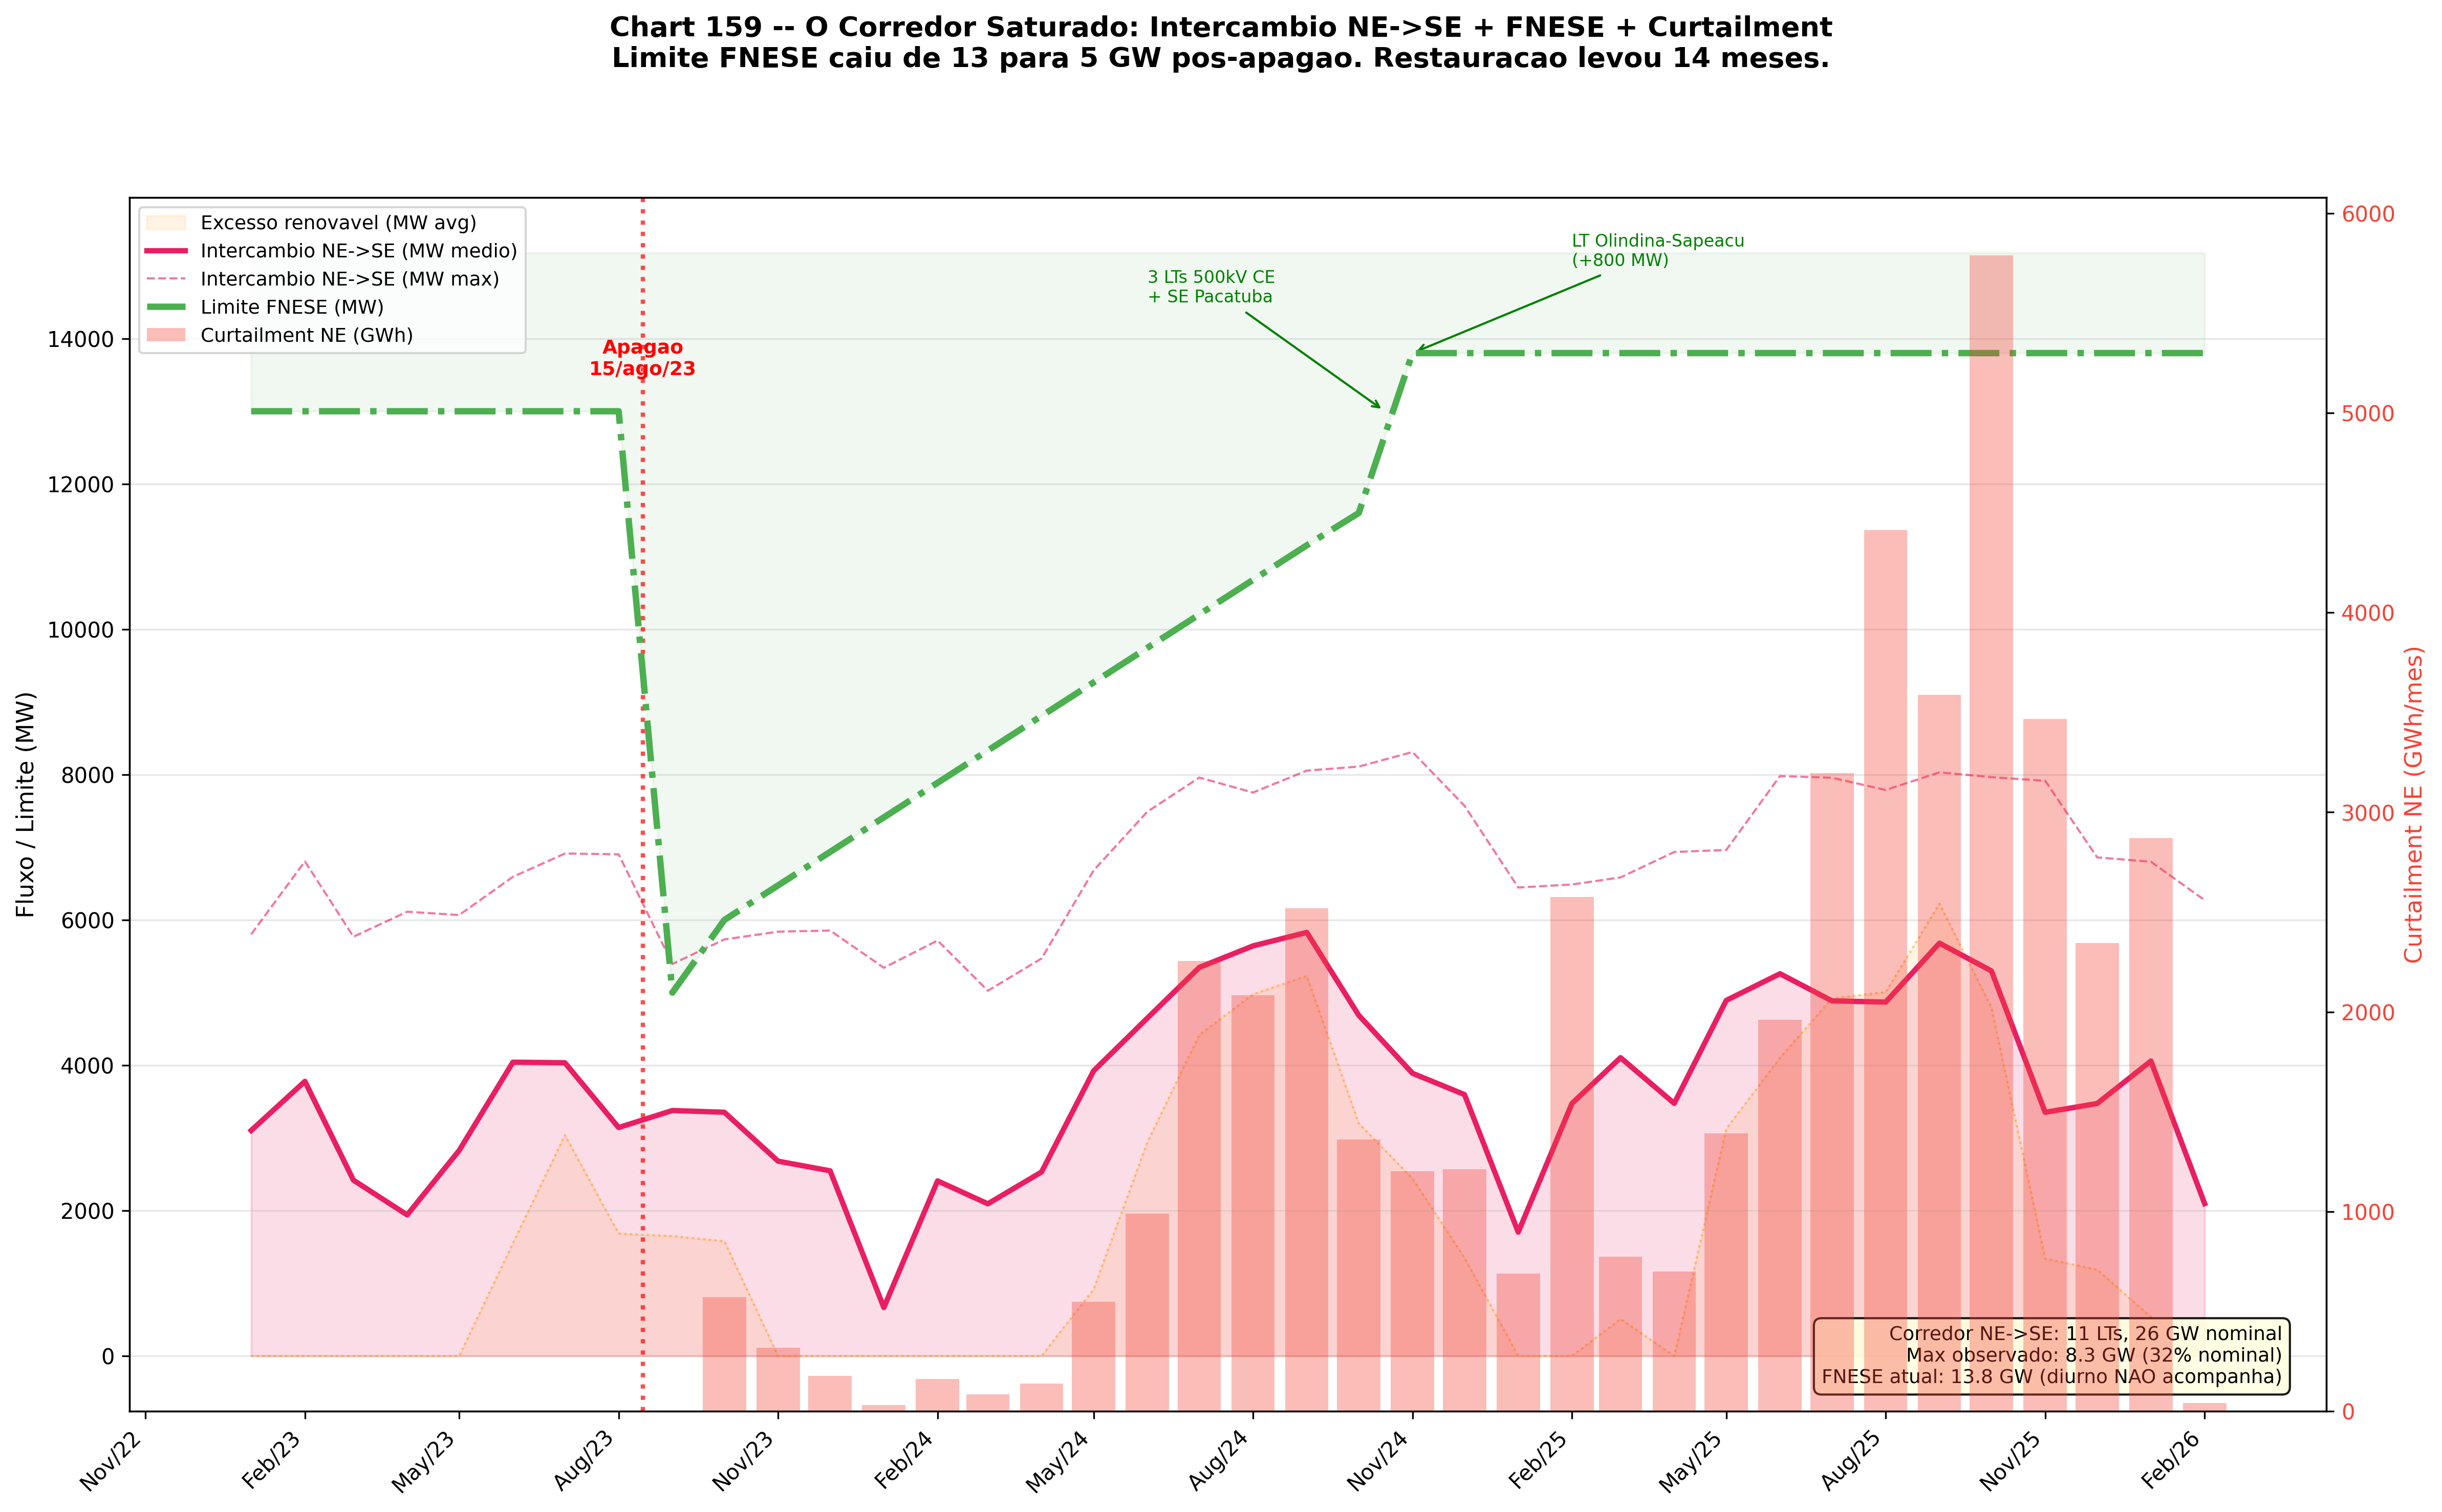
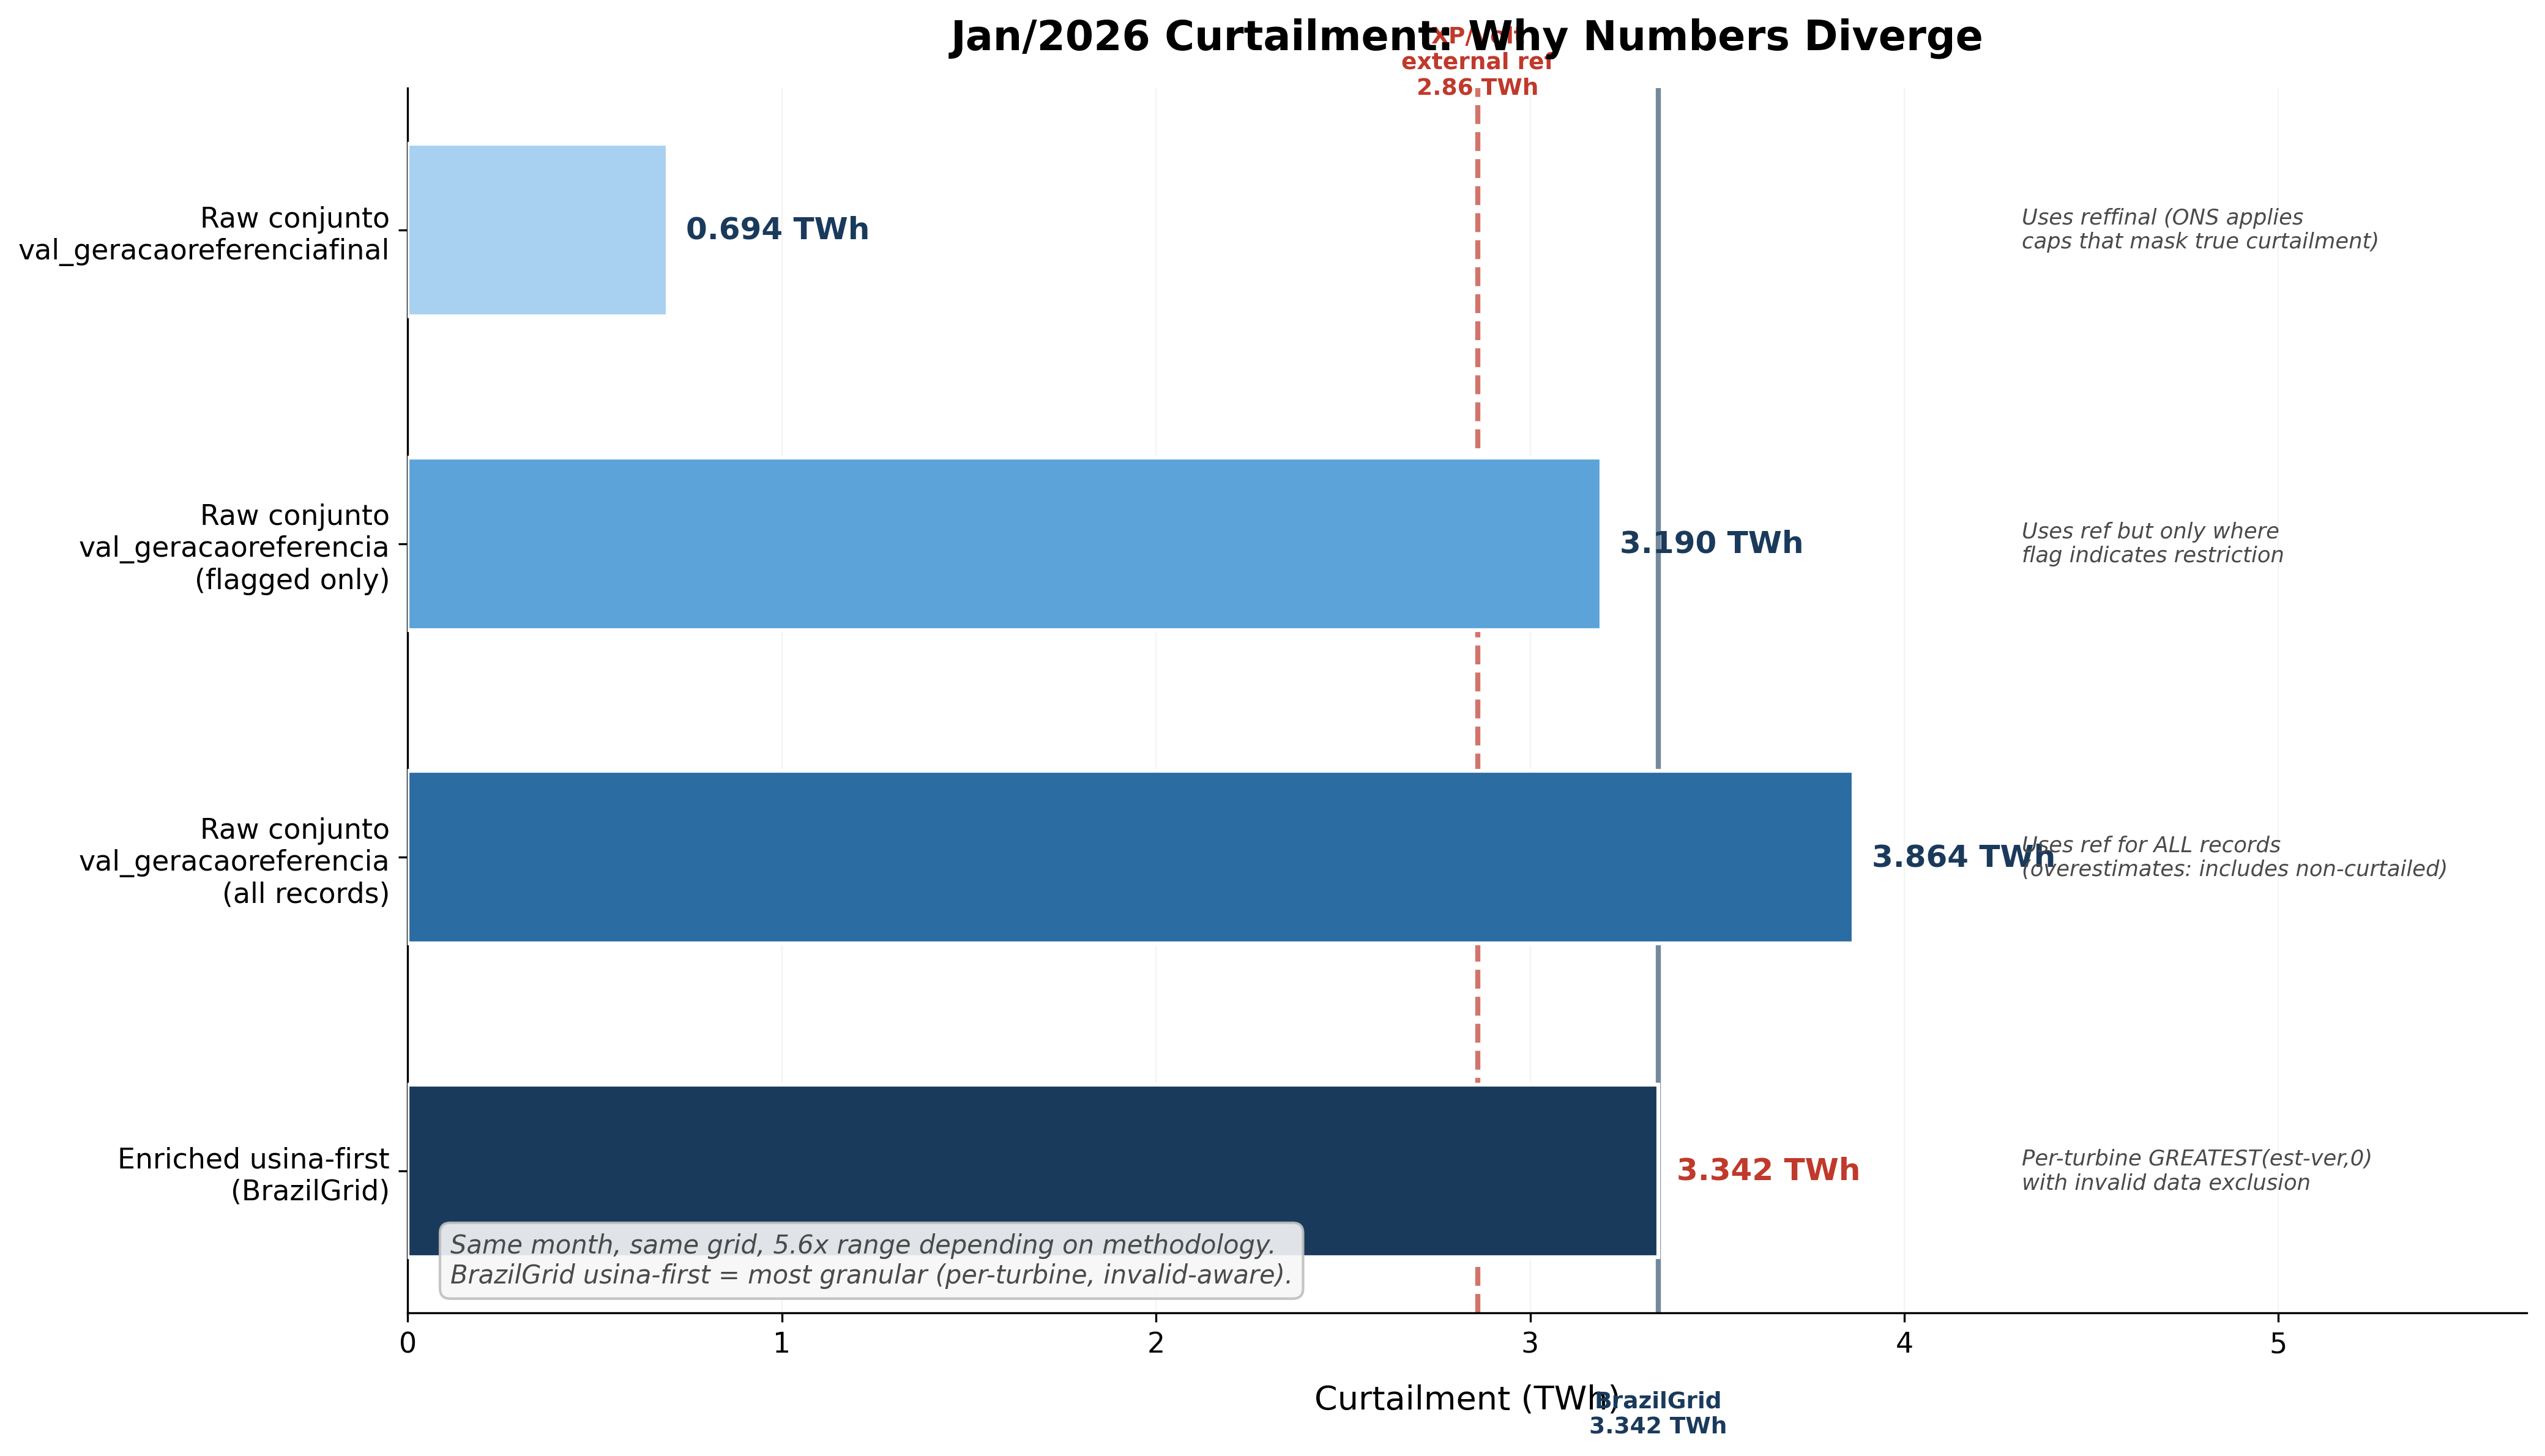
FNESE = 70% of all REL in Jan/2026
REL decomposition Jan/2026: FNESE 456 GWh (70%), Rio Novo do Sul 97.5 GWh (15%), FPOTPPA 75.5 GWh (12%). SGI Janauba 3 = 85% of FNESE.
Itabira SLA4/BET at 63% of limit
DESSEM somflux on a WEAK day: peak IPER 28 (13:30 BRT) = 812 MW = 62.9% of 1,291 MW. Strong solar day reaches 100% and curtails. BESS 500 MW = -40% pressure.
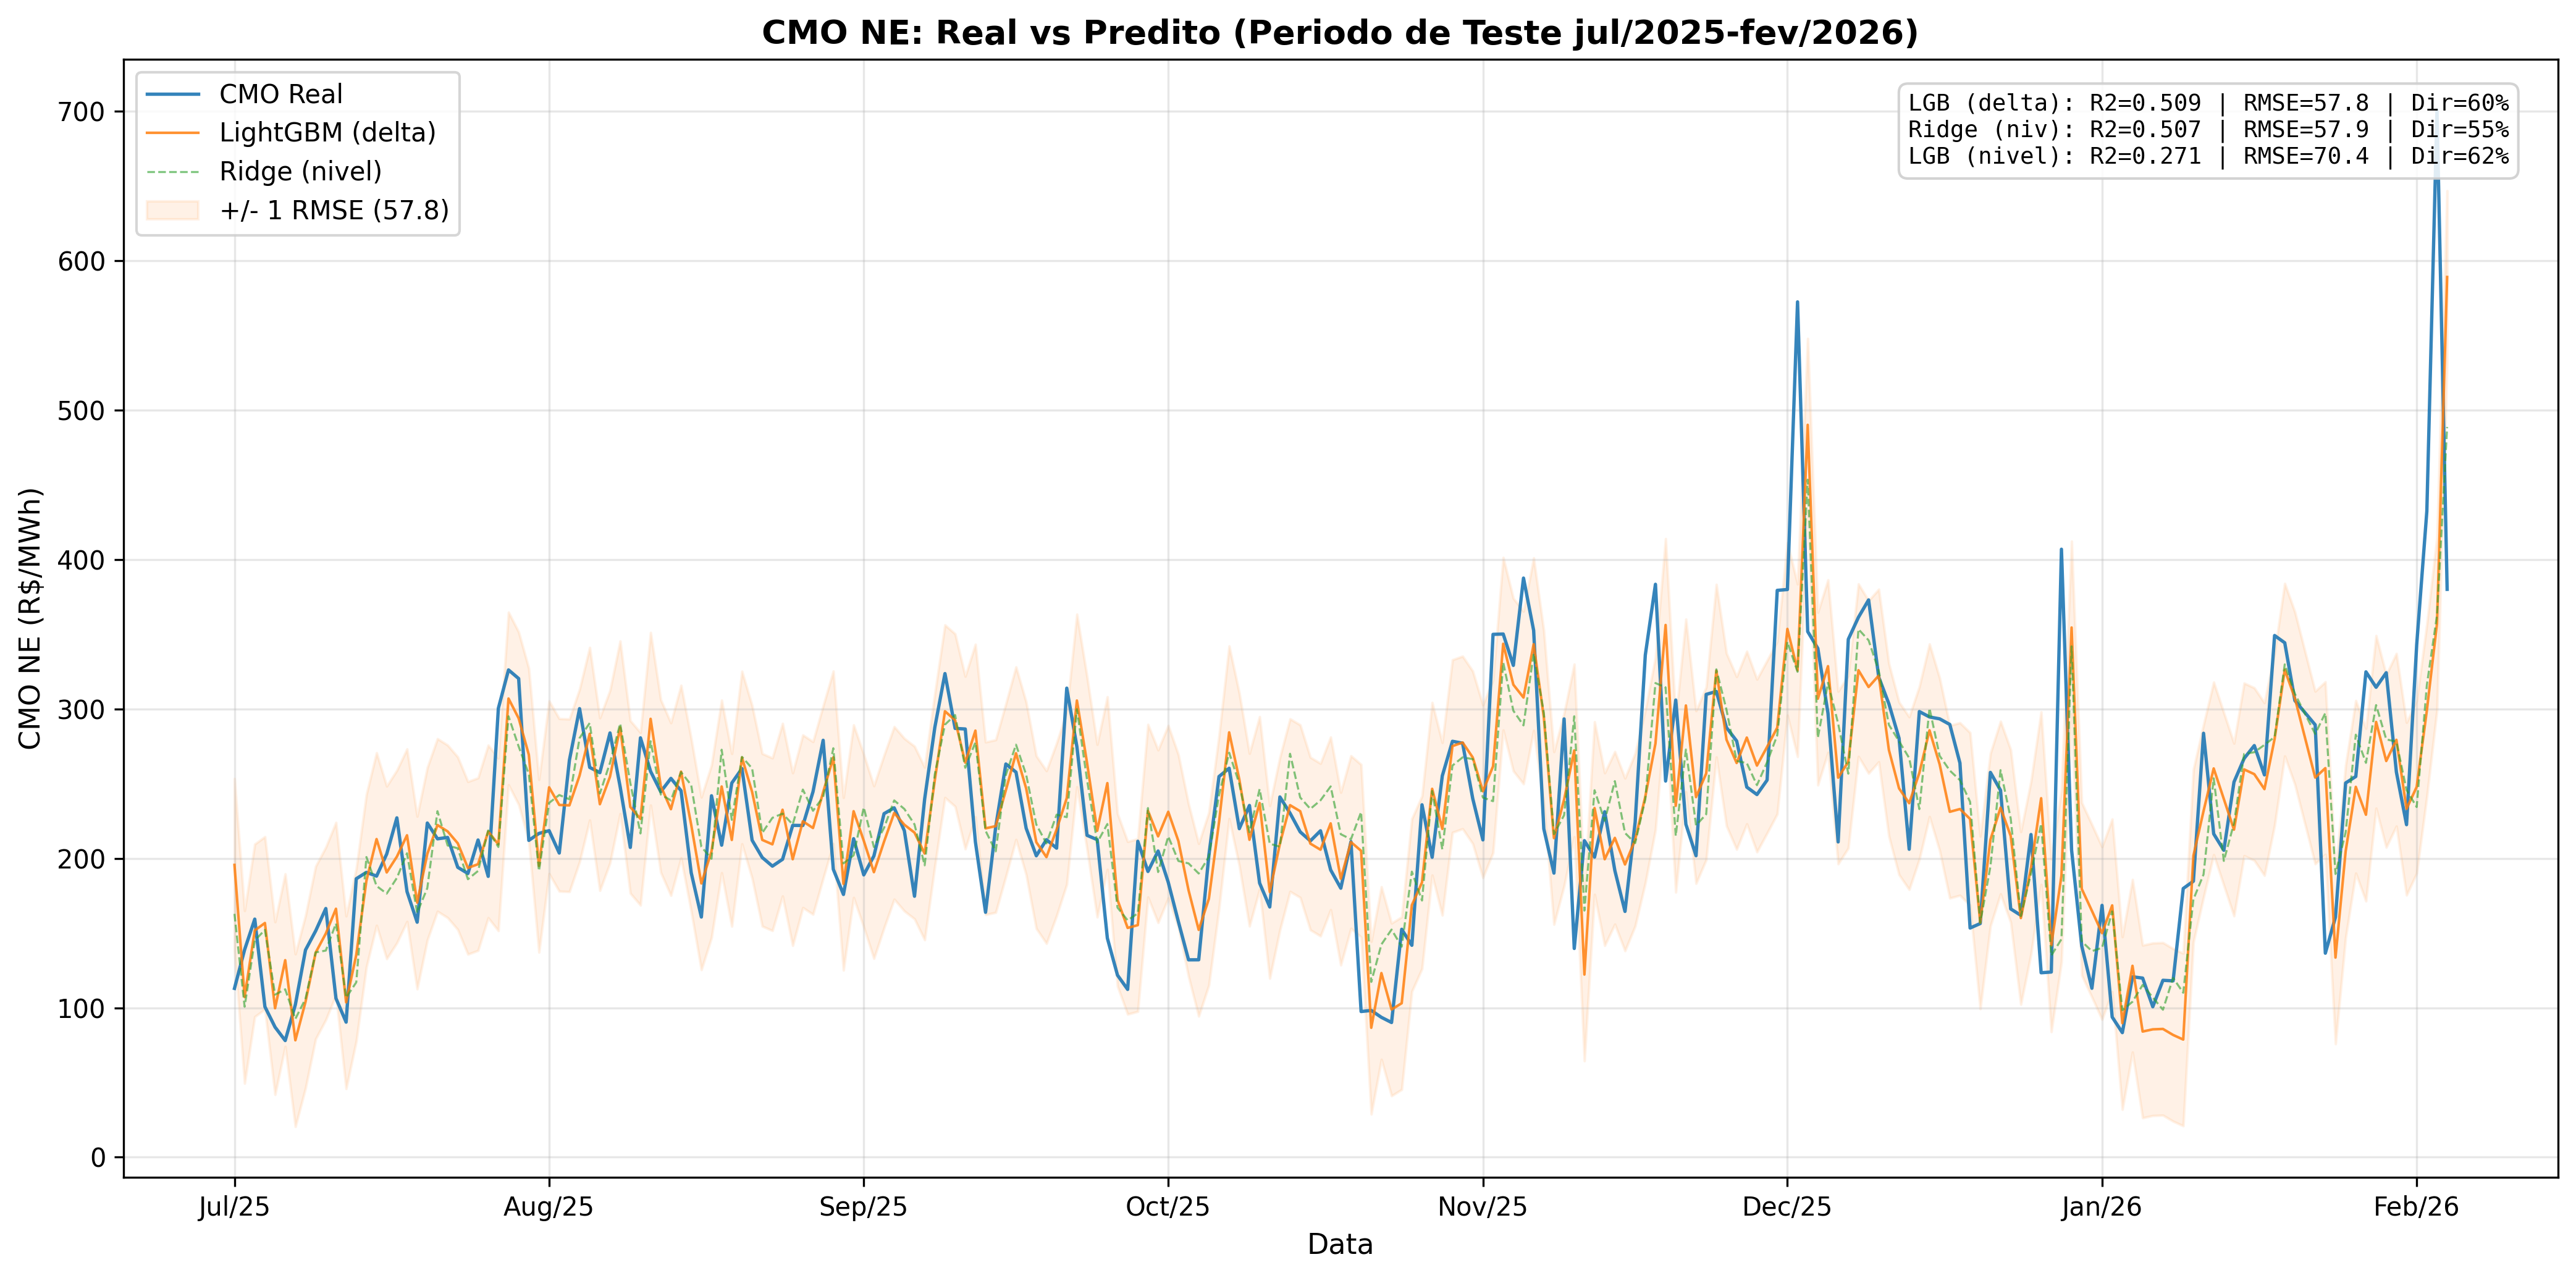
CMO D+1: regime switching outperforms persistence
CMO autocorrelation 0.916 but persistence R2=0.314. Direct XGBoost R2=0.506. CMO changes regime abruptly -- unlike curtailment which is gradual.
MG solar is NOT weather-invariant
r=0.957 between curtailment and generation (identical to NE wind r=0.950). Proportional rate, not constant. Real difference: type of constraint, not weather sensitivity.
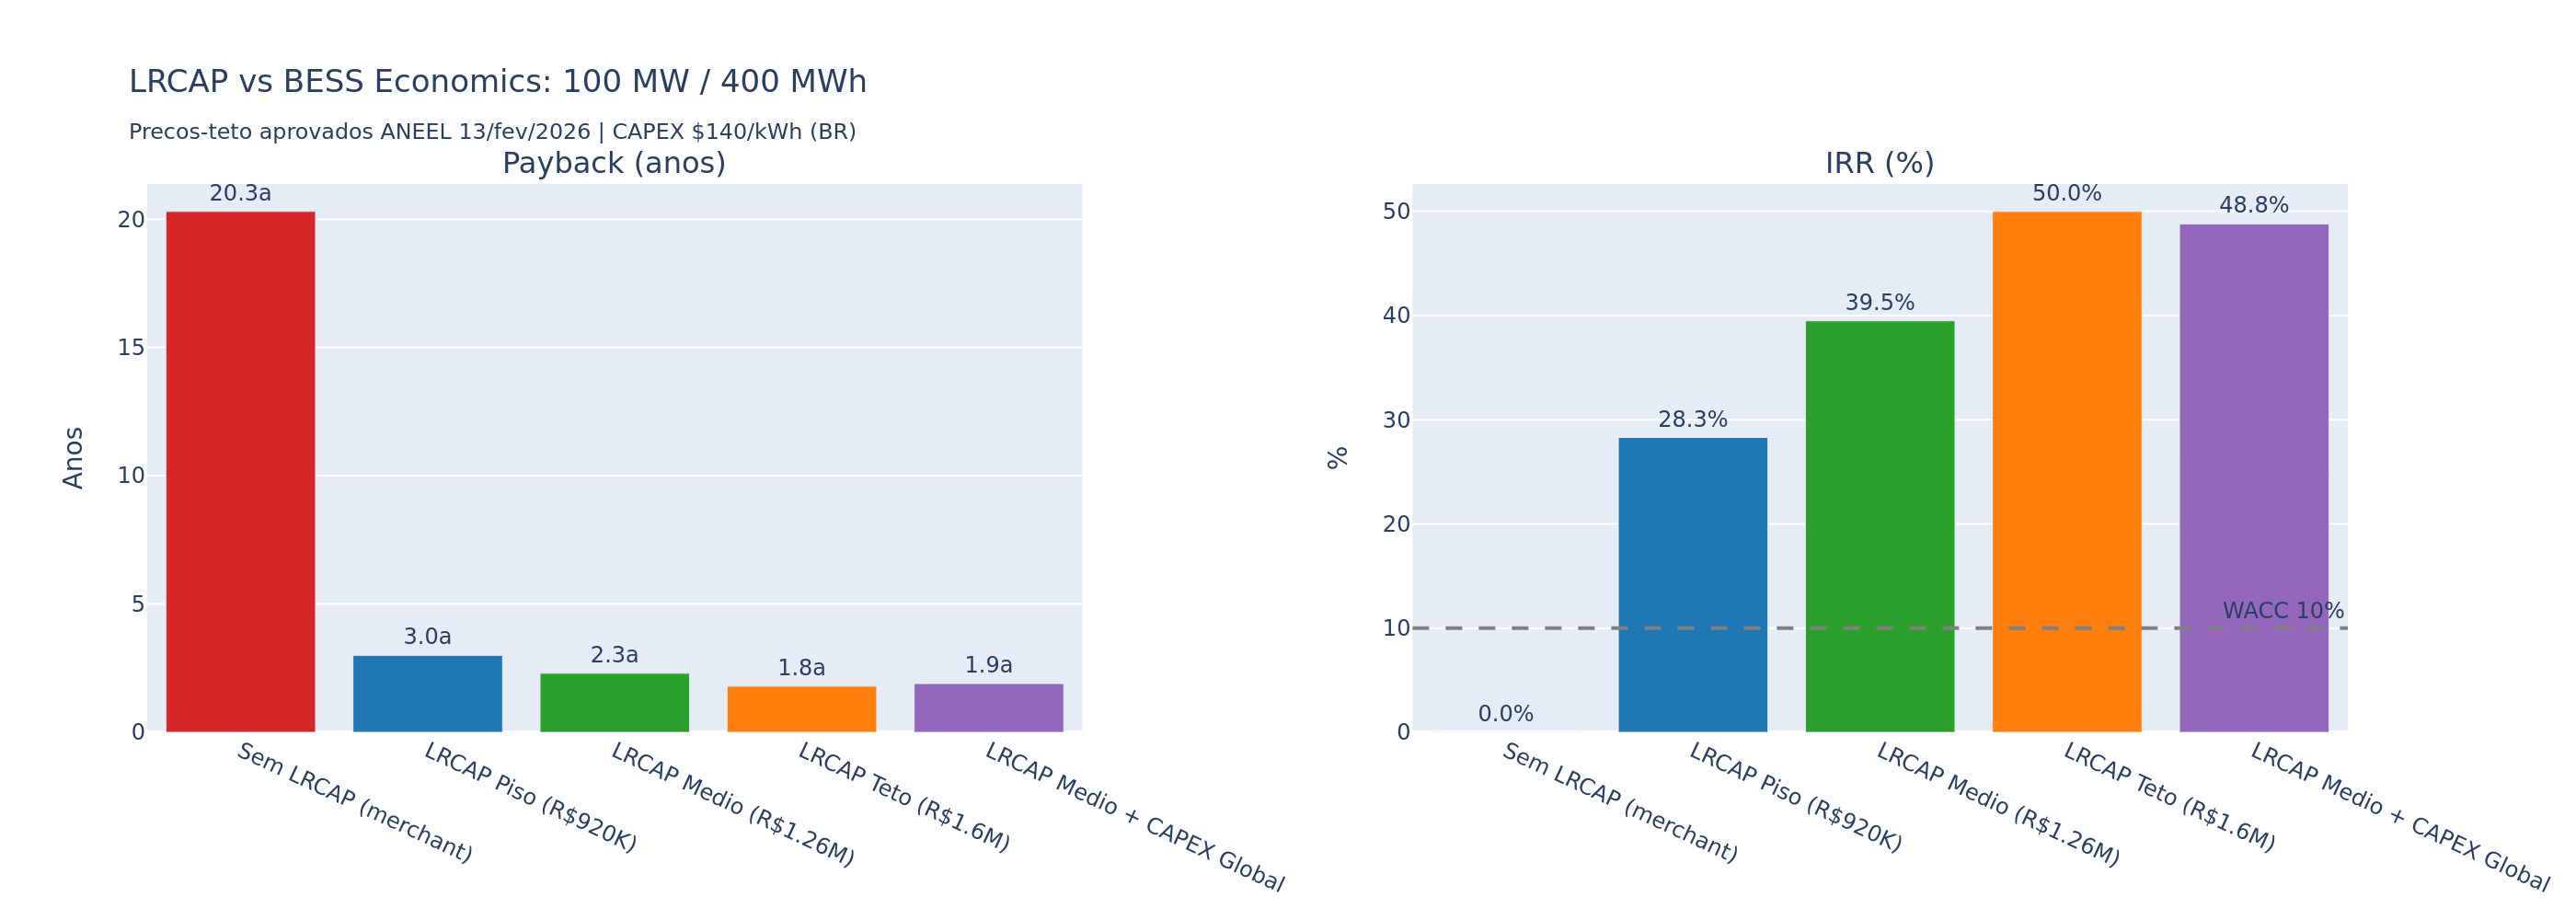
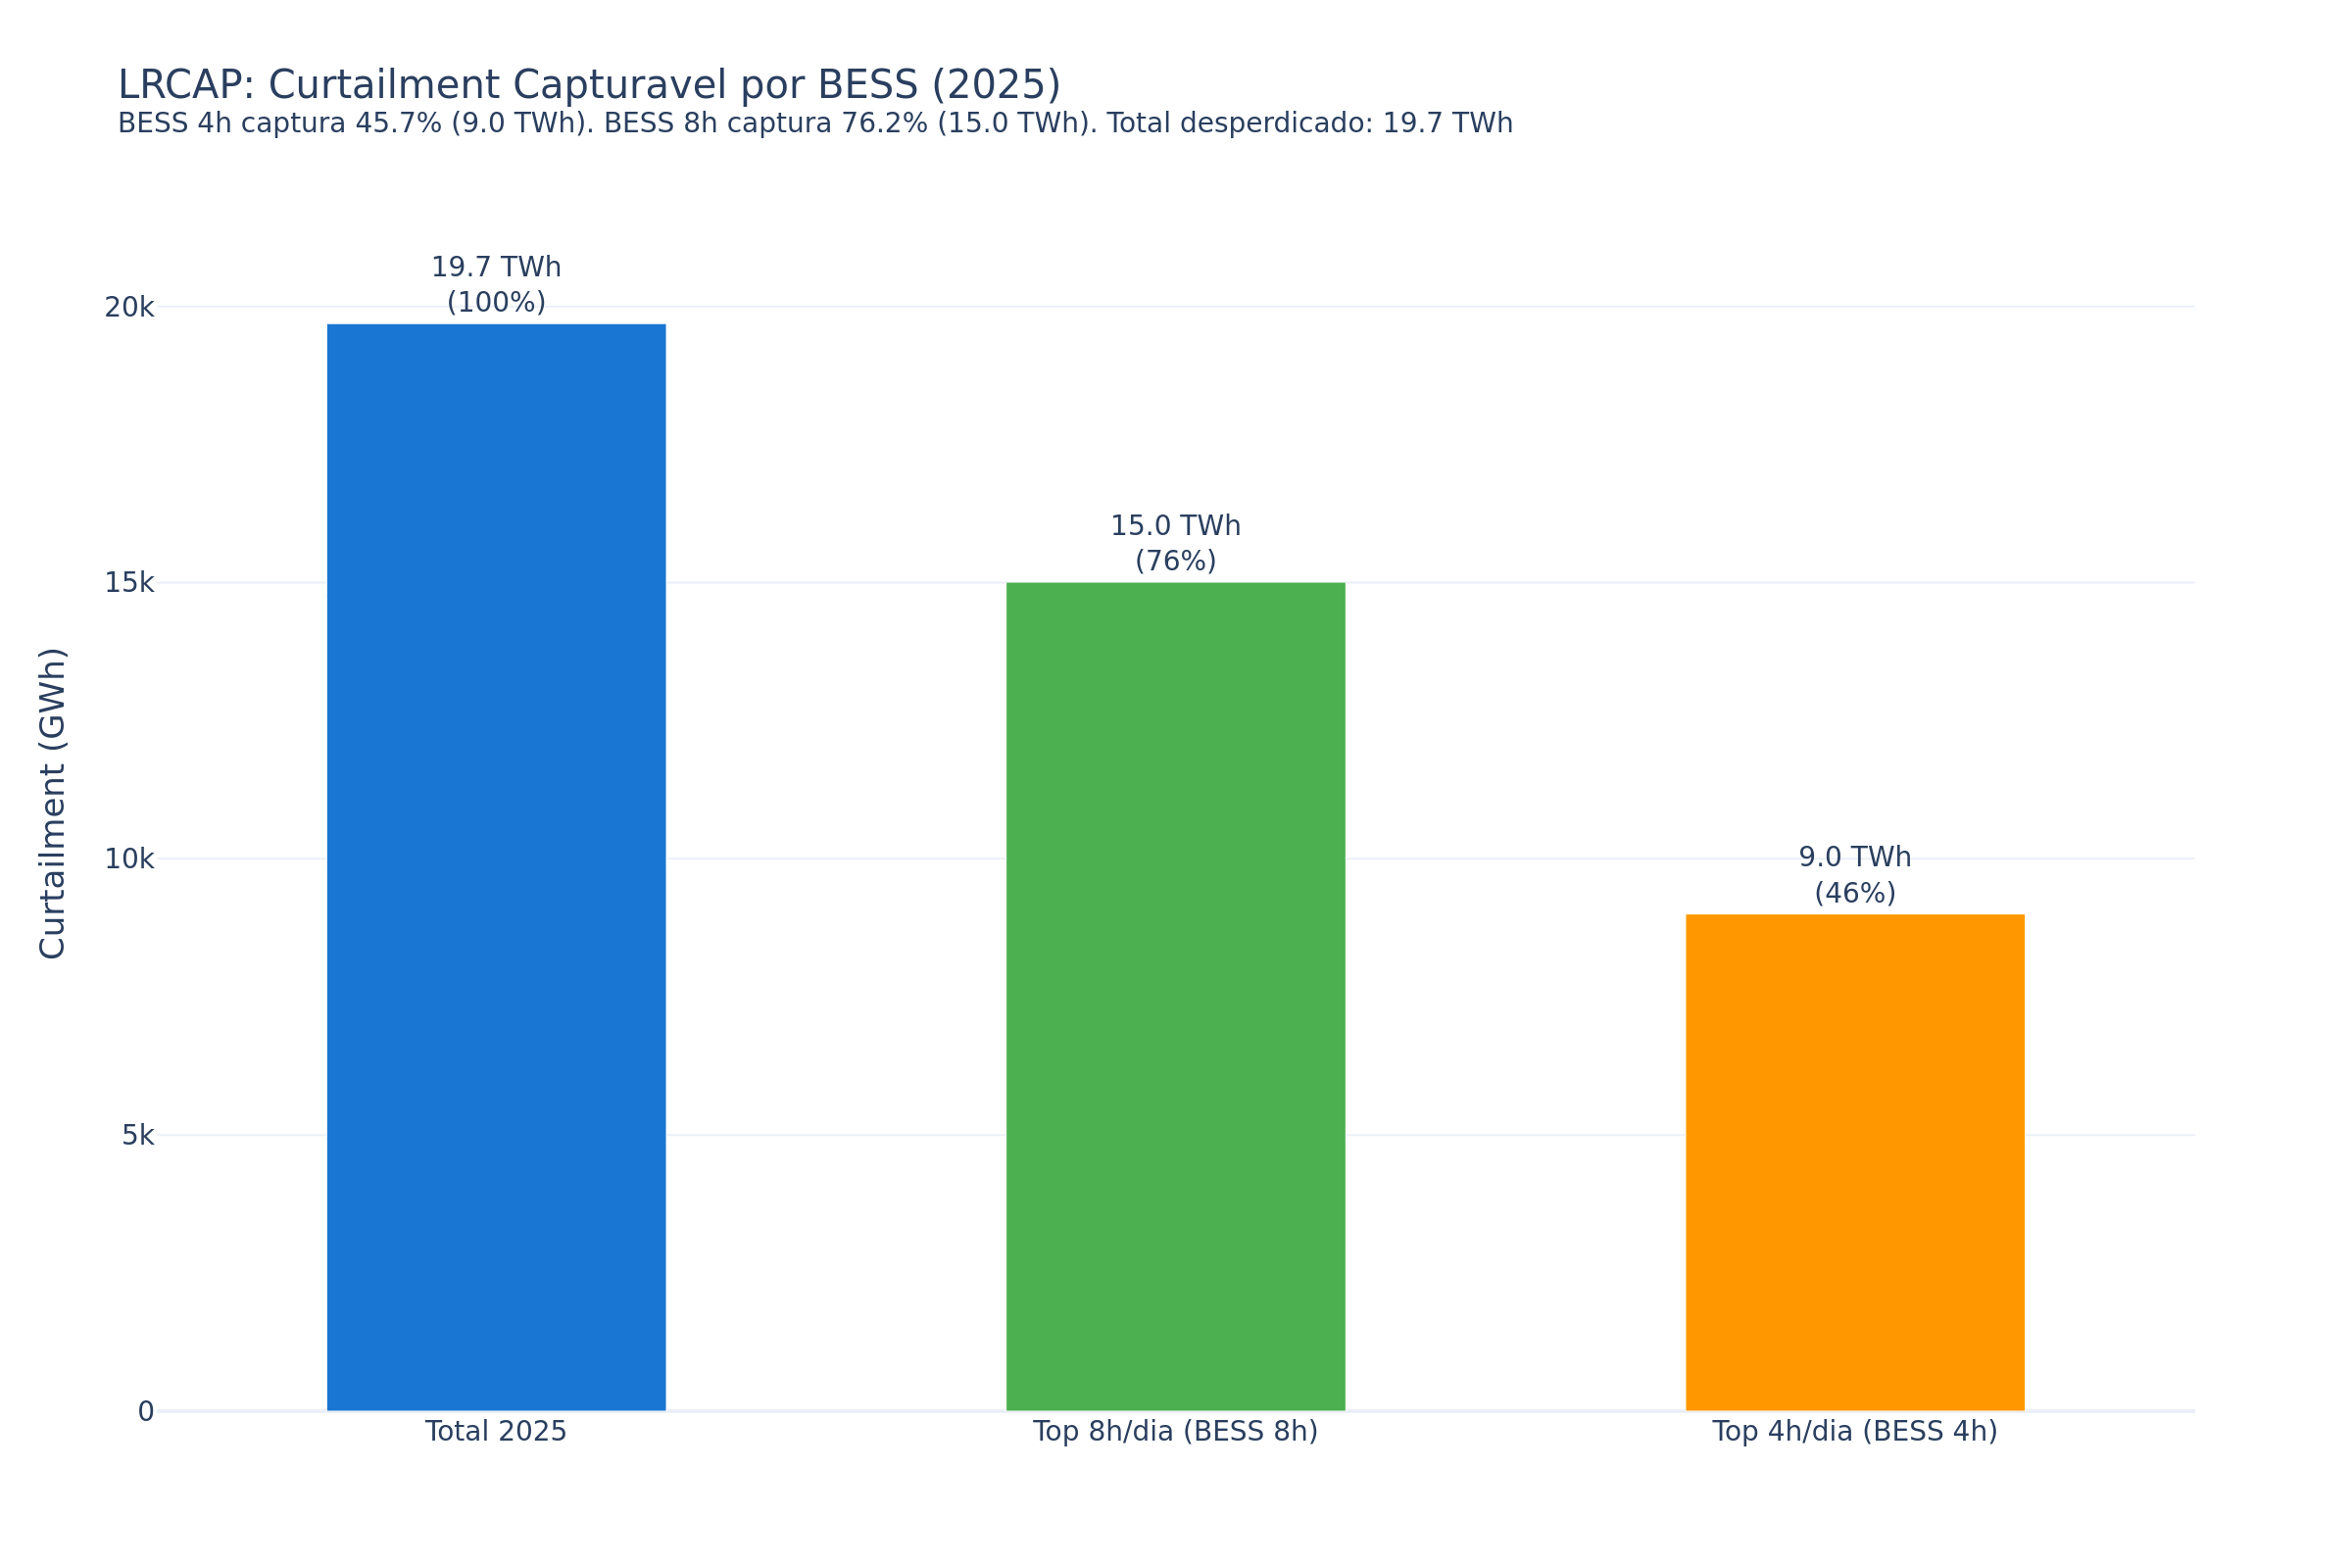
BESS 4h: 1.6-year payback with LRCAP
100 MW BESS: LRCAP R$ 290M + merchant R$ 27M/year. CapEx R$ 480M. Payback 1.6 years. Without LRCAP: 17.8 years. The auction is everything.
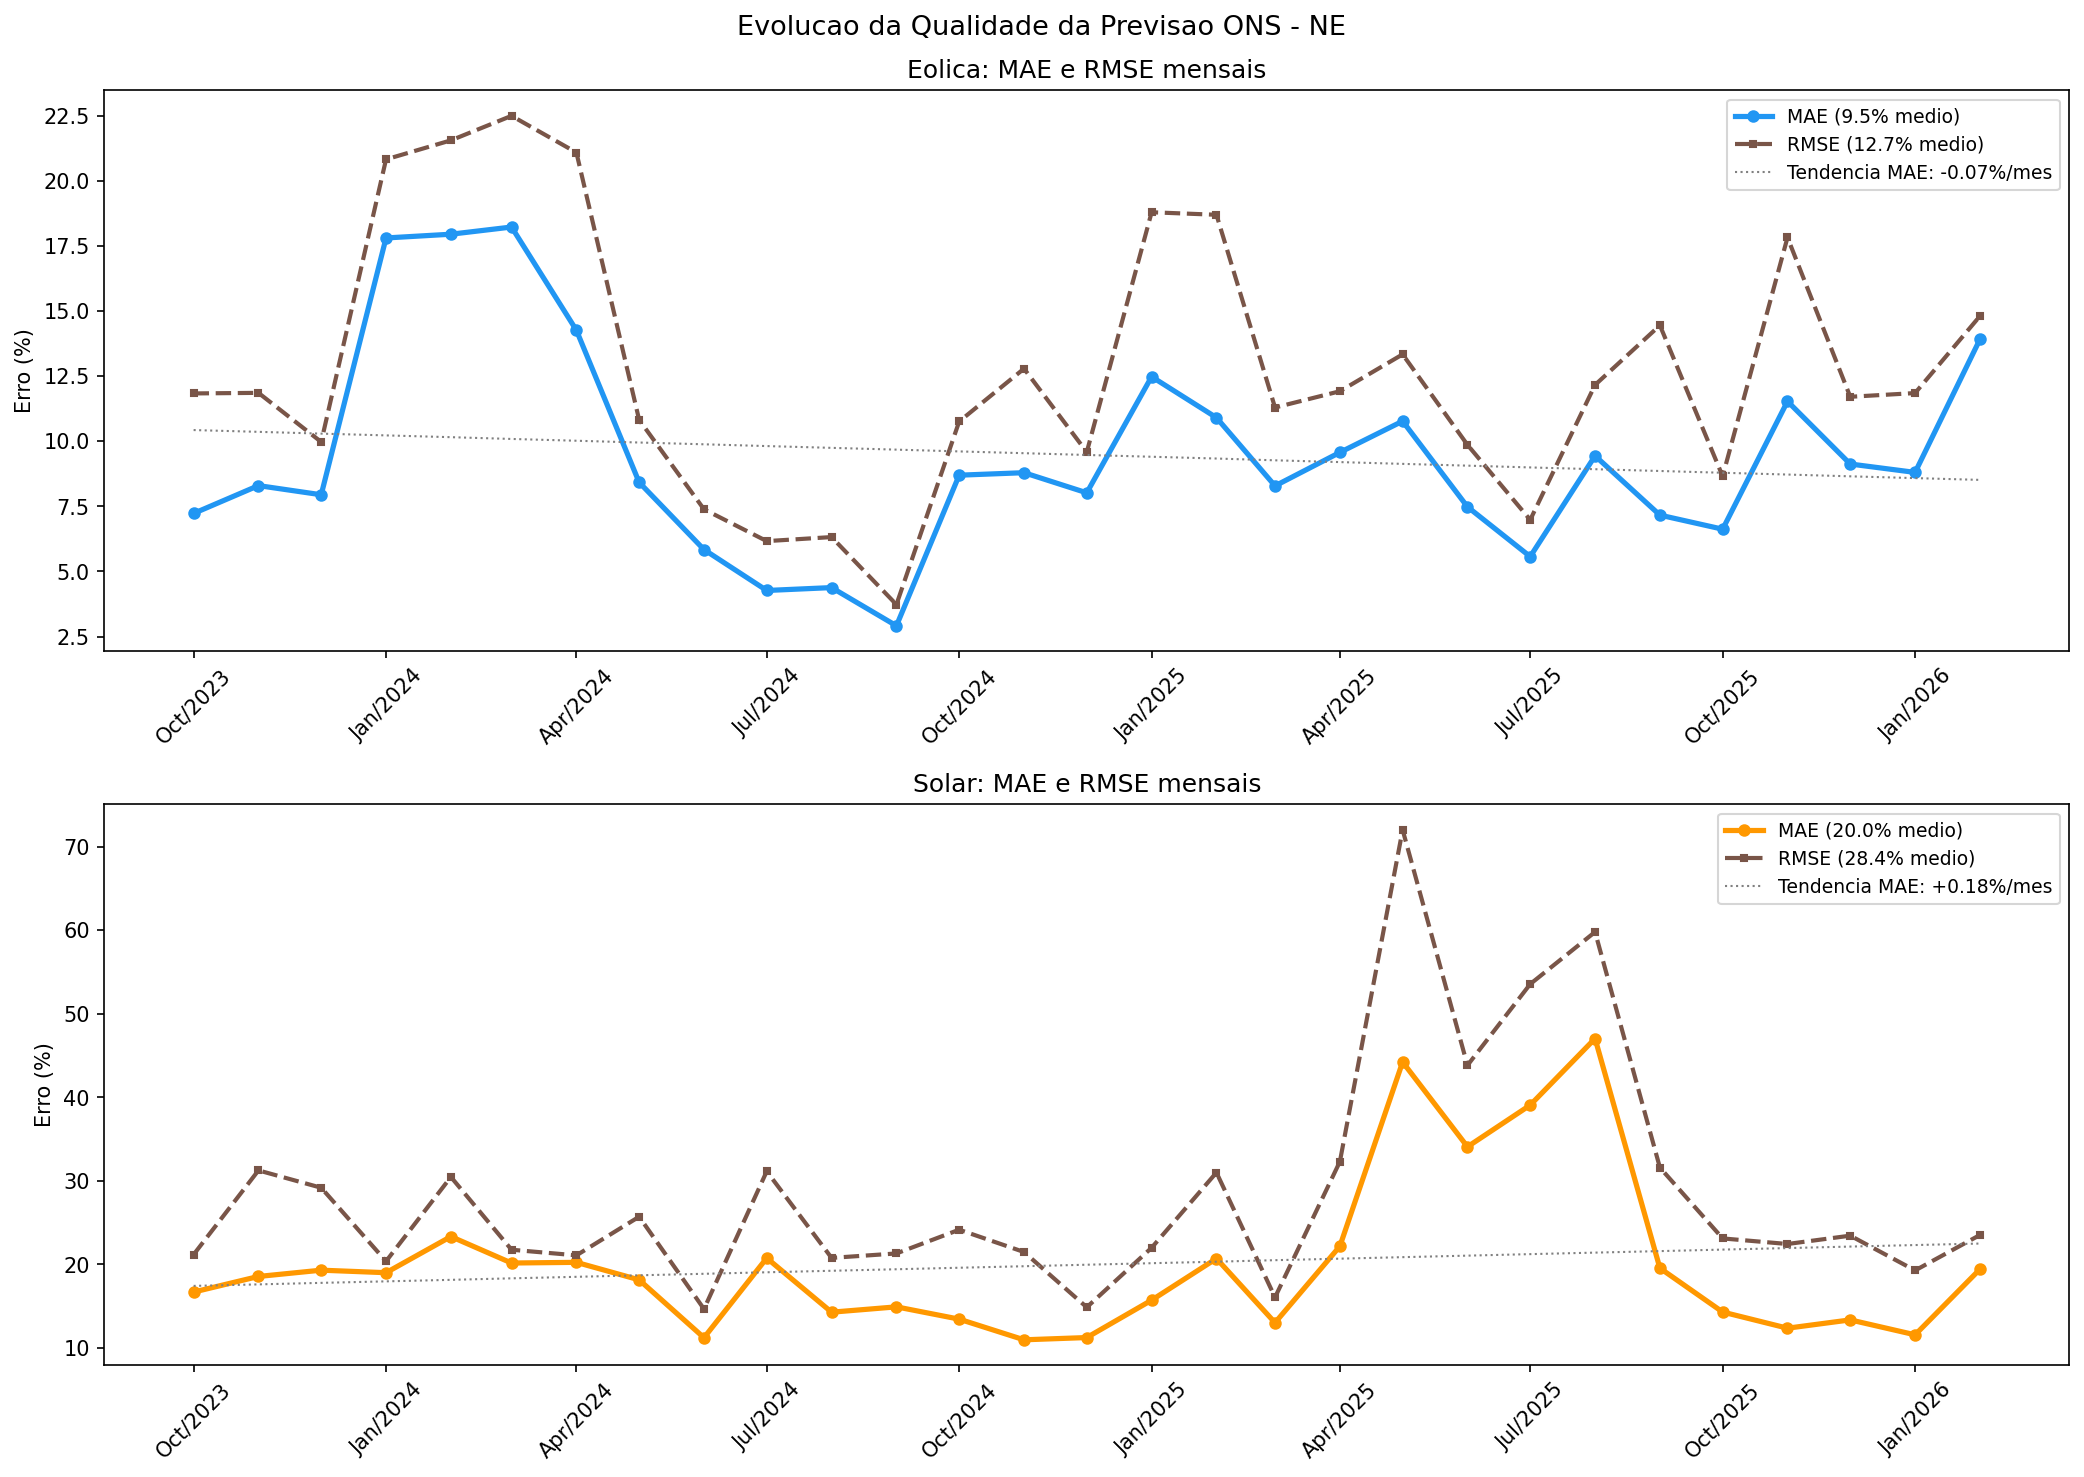
Solar VP correction: -48% error
146 plants modeled. Per-plant XGBoost reduces median MAE by 48.1% (8.35 to 4.50 MW). Outperforms wind correction (-41.1%). Proof that forecasting is improvable.
Congestion costs R$ 1.77B/year
CMO NE vs SE difference multiplied by curtailment. Average spread R$ 41/MWh, peak R$ 1,154/MWh. This is the cost that TX expansion would directly capture.
HHI dropped 41%: curtailment deconcentrated
HHI 145 (2024) to 86 (2025). Top 5 clusters: 17.1% to 10.1%. No longer a problem of a few parks -- it is systemic. Monotonic deconcentration.
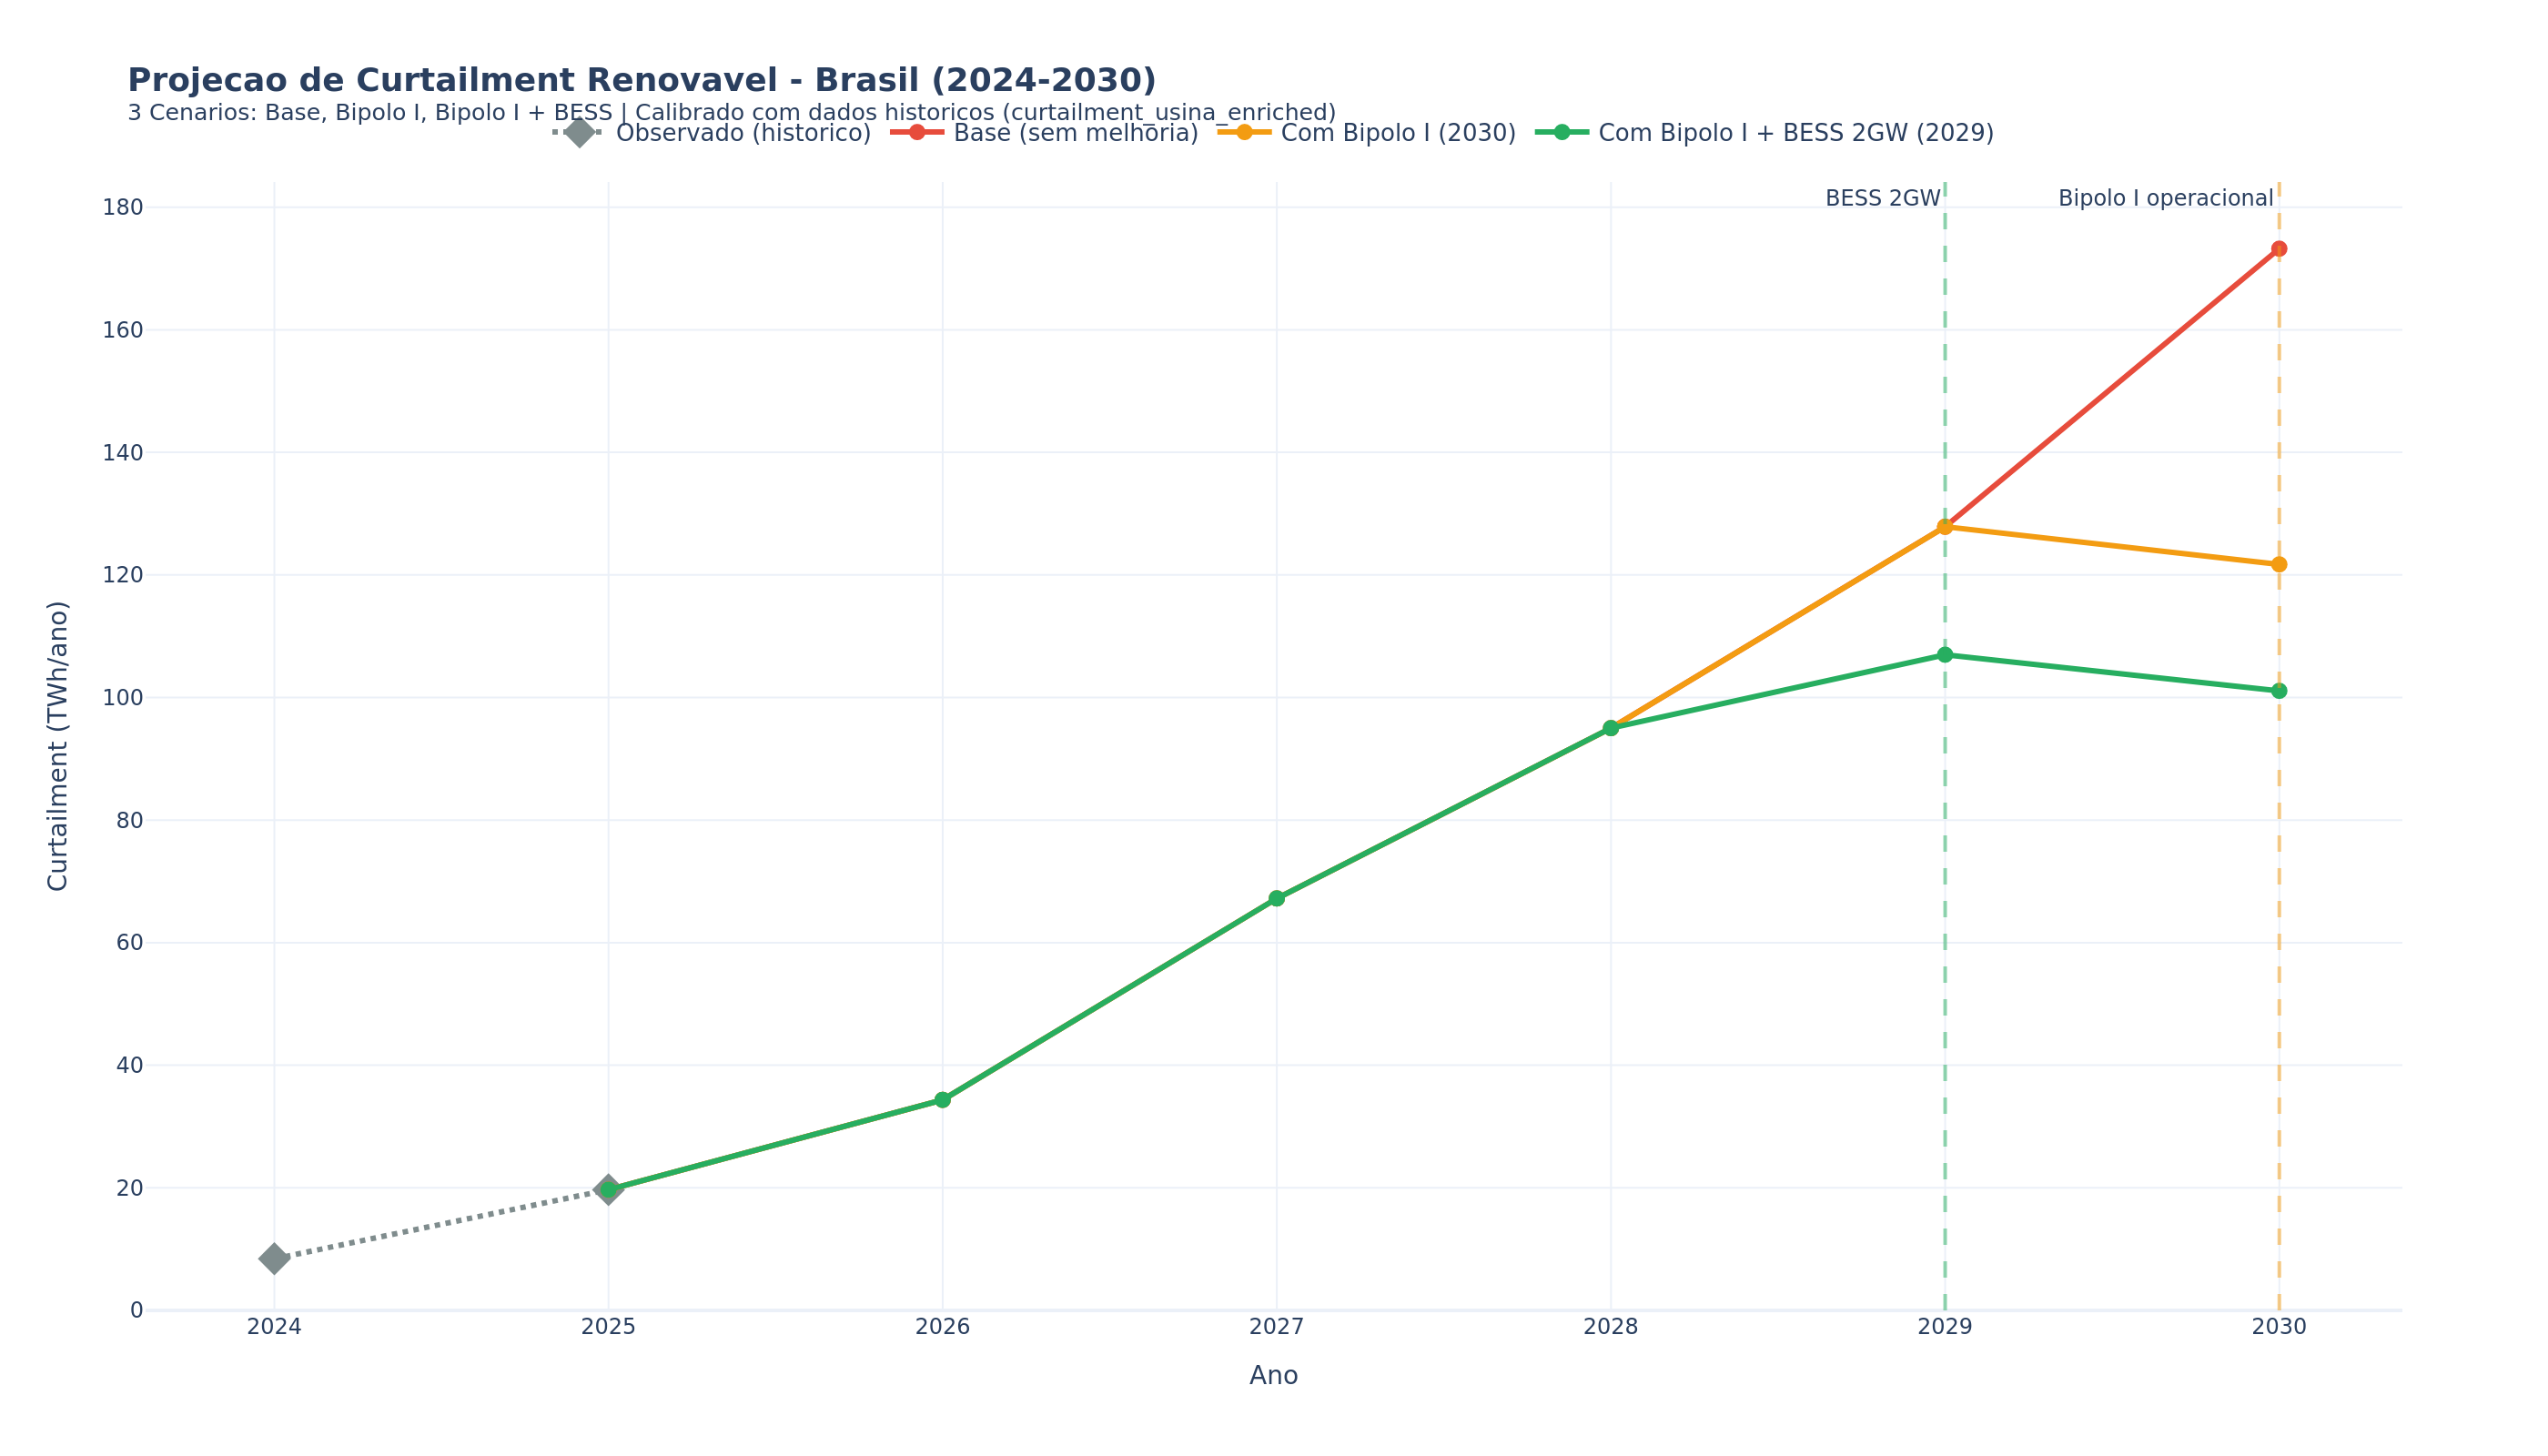
57 TWh projected for 2030
Logistic model calibrated by state: Base 57.4 TWh (+49%), Optimistic 53.3 TWh (+38%), Pessimistic 64.3 TWh (+67%). MG solar largest proportional mover (+81%).
BA: +215% YoY, new epicenter
Bahia surpassed RN as #1 state in Jan/2026. NE share: 20.5% to 42.6% in 1 month. 12 Bahia clusters in top growth. Driver: REL explosion (190x).
ONS classification: 87.5% predictable
A 2-rule predictor (day regime + BRT hour) classifies CNF vs ENE with 87.5% accuracy. Mechanical crossover at 11h BRT. 232 of 236 clusters switch simultaneously.
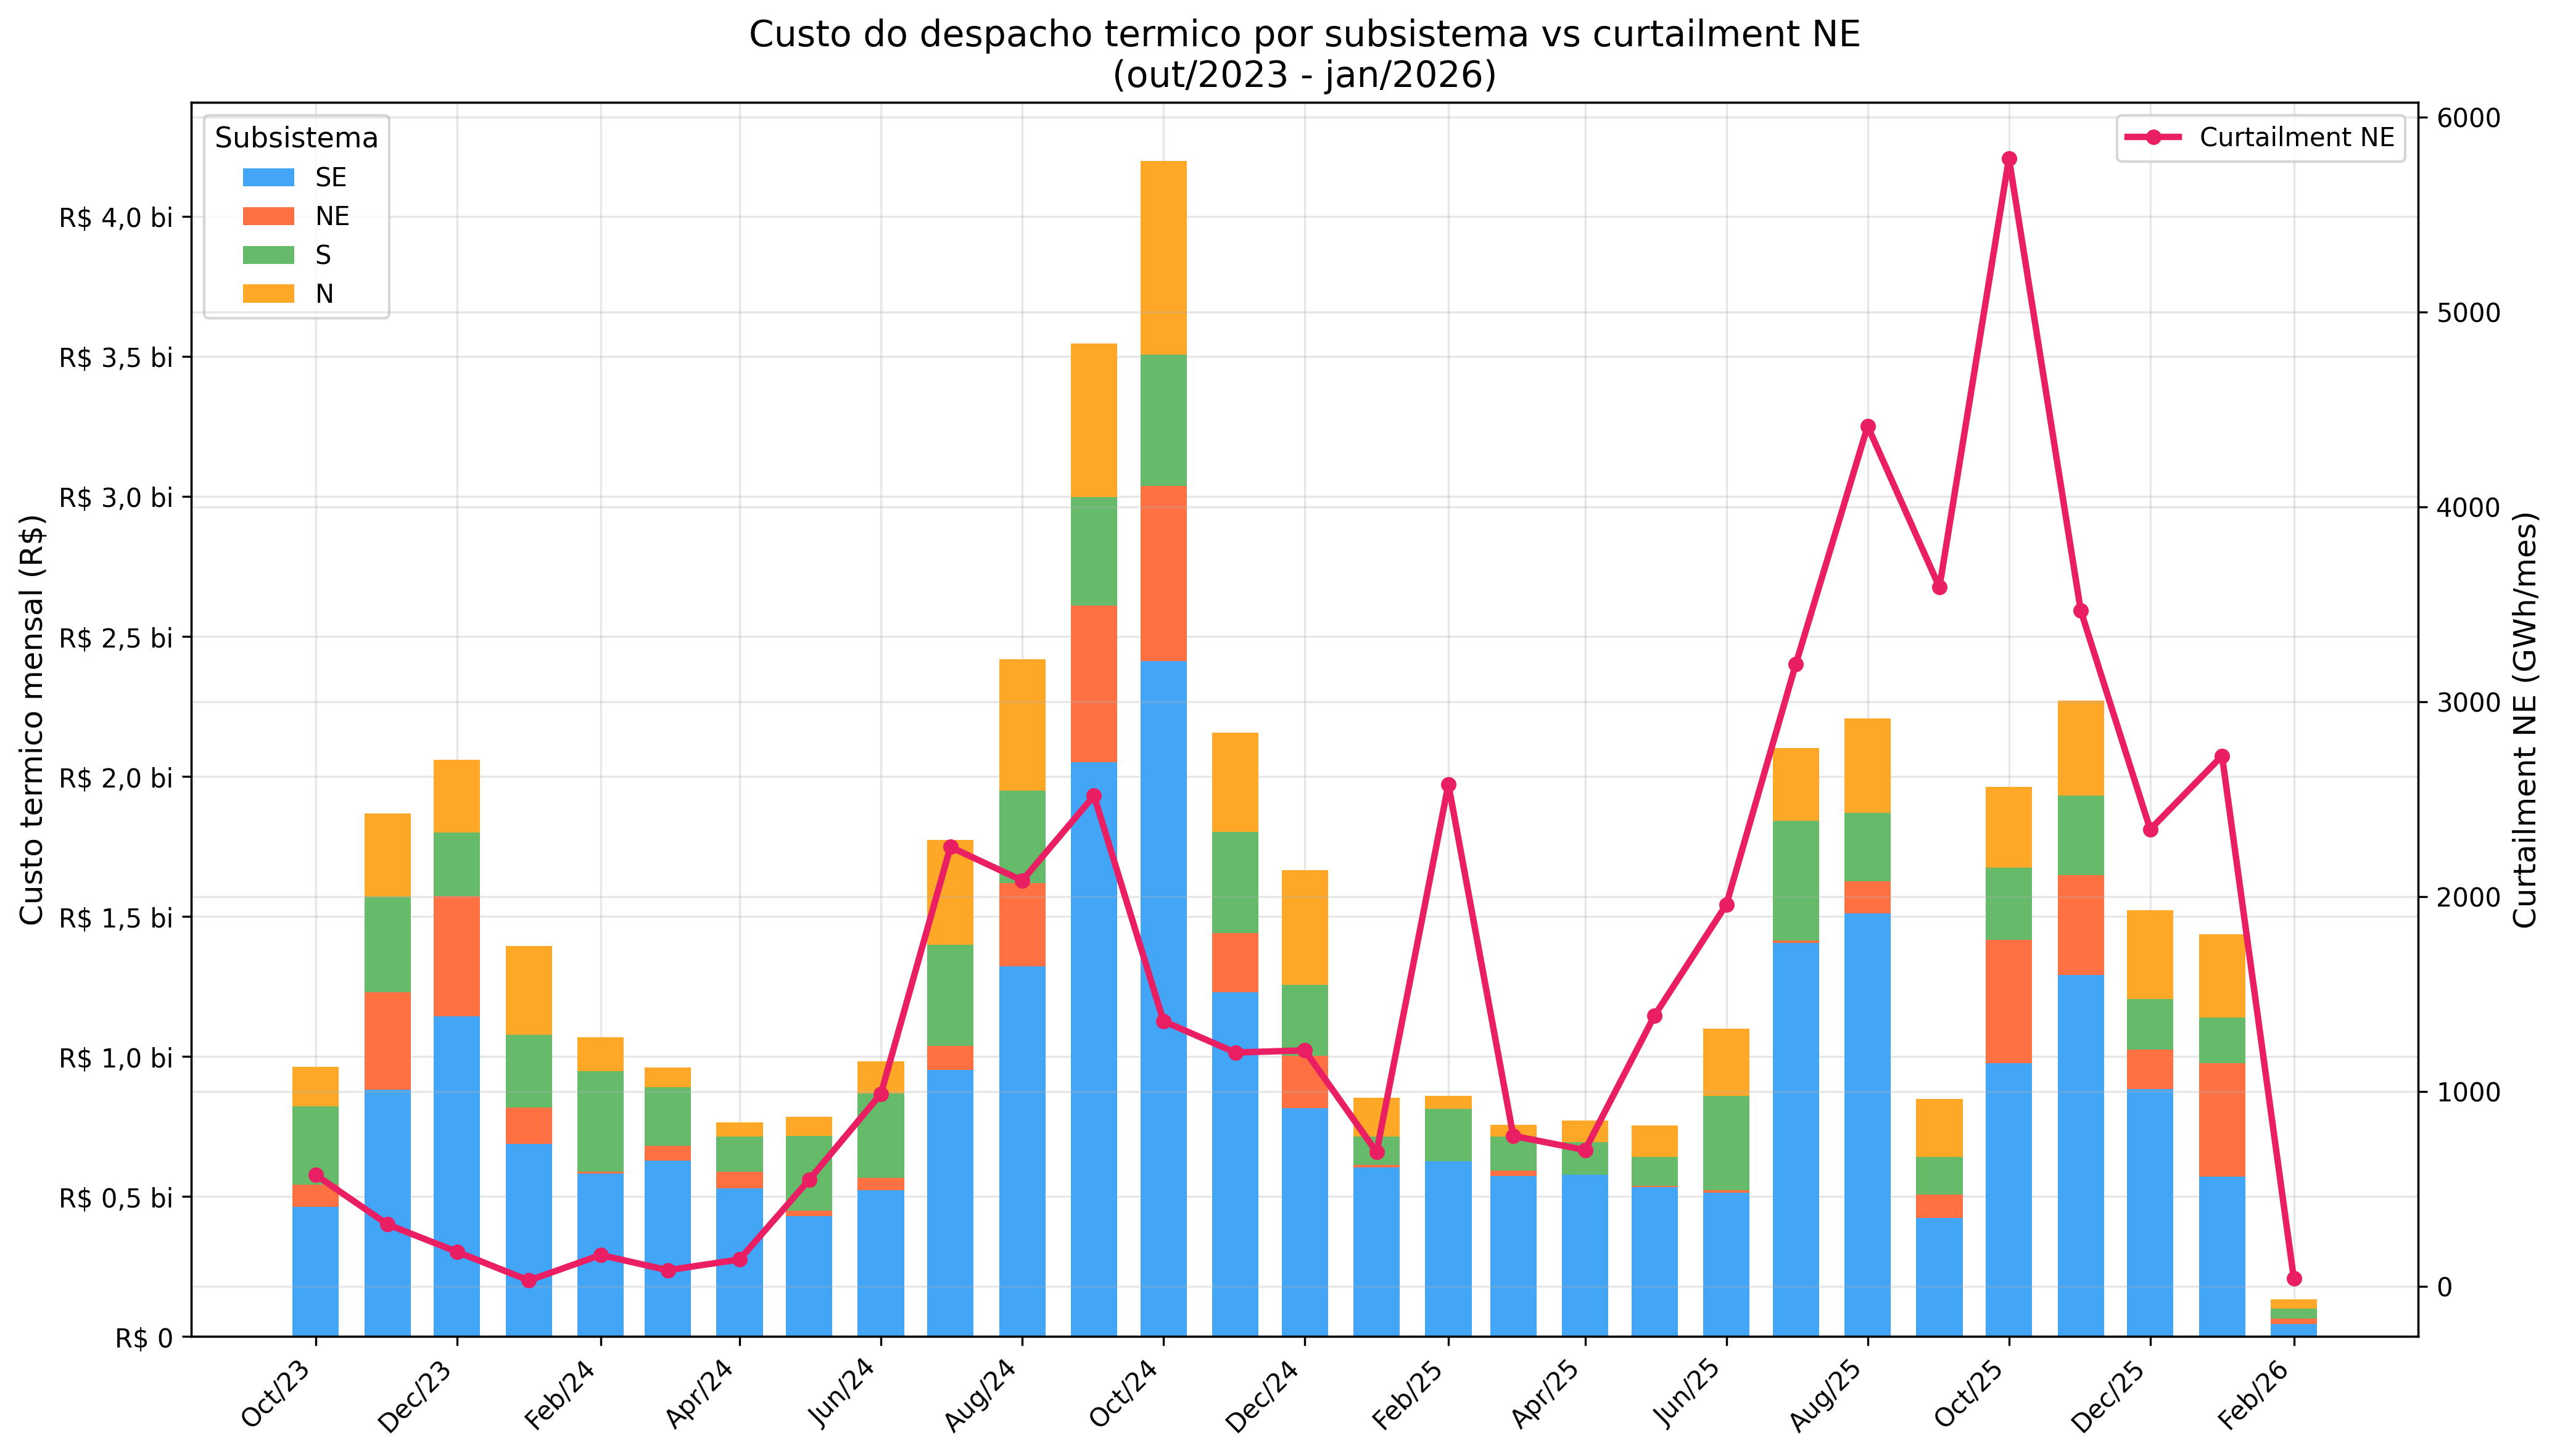
NE thermal: +65.5% above DECOMP
DECOMP projected 739 MW NE thermal, actual was 1,223 MW. Porto Sergipe I burned gas at R$ 300/MWh while renewables were curtailed in the same subsystem.
Night share DROPPED: 26.2% to 21.9%
Q3 nighttime collapsed: 31% to 18.7%. Zero night-dominant days in Q3/Q4 2025. Daytime ENE +335%, nighttime CNF +62%. Night will never surpass 50%.
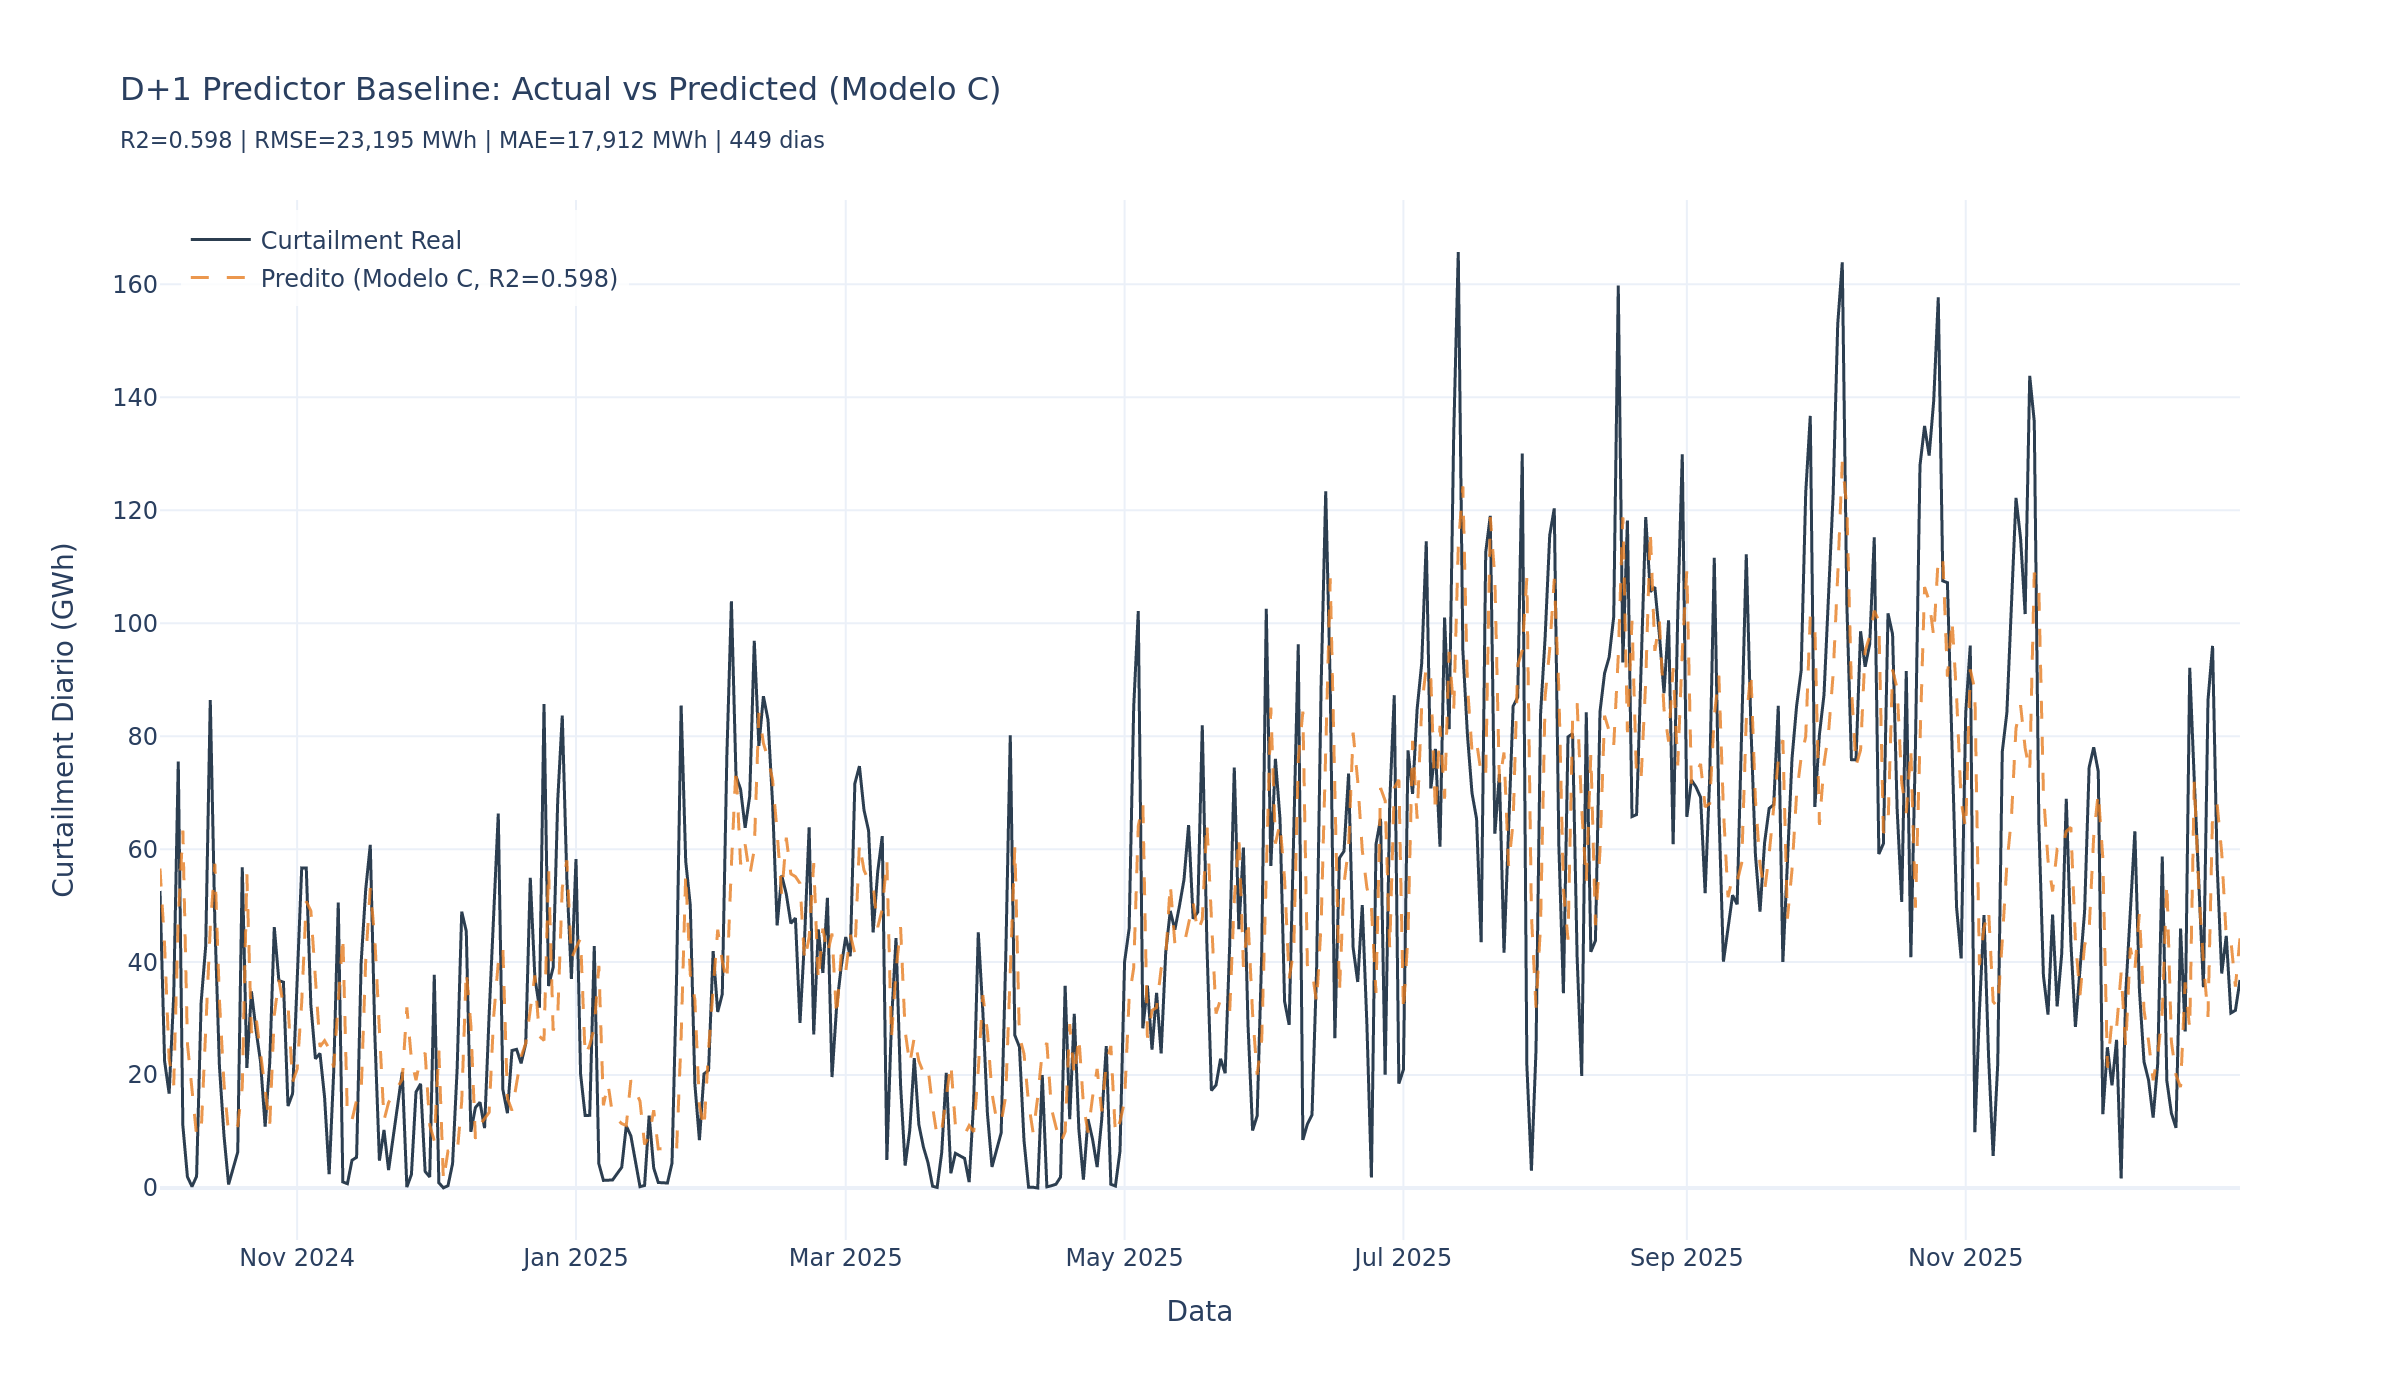
D+1 hybrid: -14.9% MAE
Persistence+XGBoost: MAE 35.5 GWh (-14.9%). Direct XGBoost FAILS (R2=0.468). Calendar (day of week) is feature #1. 73.8% predictions within 50 GWh.
662 revoked plants = 27.8 GW
ANEEL Dispatch 188/2026: 153 plants (5.78 GW). Cumulative: 662 plants = 27.8 GW abandoned. 2x Itaipu capacity that will never be built.
SE solar absent from DECOMP
DECOMP projected 2,190 MW SE solar, actual 5,854 MW (+167%). The entire impact of solar on operations is a weekly surprise.
Curtailment autocorrelation: lag-1 = 0.75
Jumped from 0.631 (2024) to 0.750 (2025). Decorrelation doubled: 2 to 4 days. Curtailment is increasingly persistent and predictable. Baseload behavior.
Wind saturation ~55-60% rate ceiling
CE wind: 53.9% to 59.0% (+5.1pp, decelerating). Physical grid limit creates self-regulated ceiling. All wind states converging to 50-55% by 2030.
Reverse flow NE-SE: 5.2% of hours
1,399 periods with the Northeast IMPORTING energy since 2023. Minimum: -1,916 MW (Feb 4, 2026). A system designed to export, not import.
Data centers: 26.2 GW in queue
ONS approved 7,298 MW in the first Redata batch. Total 26.2 GW in requests. Potential to absorb energy that is currently wasted in the NE.
BESS market: R$ 2.2B in 2025, R$ 23B by 2030
BESS market tripled in 2025. WEG building 2 GWh/year factory in Itajai. BNDES financing R$ 280M. Structural turning point.
Wind VP correction: -41.1% MAE
50 per-cluster XGBoost models. Median MAE reduction: 41.1%. ONS VP curve has systematic bias correctable with ML. Applicable to 236 clusters.